View Script Performance in a Popup
You can open your analytic application or optimized story in view mode to view and analyze the performance of the running scripts in the script performance popup, which appears as a swim lane diagram.
Open Script Performance Popup
Procedure
-
To enable the script performance popup, do either of the following:
-
In view time, enter the parameter APP_PERFORMANCE_LOGGING=true in the URL.
TipEnter the parameter in front of the # character in the URL and precede the parameter with a question mark ?.
-
From Tools in the edit time toolbar, select

 (Performance Optimization)
  Analyze Script Performance in View Time
 .
.The application or story opens in a new tab, with the parameter added to the URL.
-
- When the application or story is fully loaded, press Ctrl+Shift+A or Ctrl+Shift+Z.
Analyze Script Performance
In the script performance popup, the performance results are displayed in a swim lane diagram where each script event is represented as a blue lane. The events are numbered according to the running sequence. As the scale is the same for all events, you can immediately identify the long running events.
From tooltip you can see the exact running duration of an event.
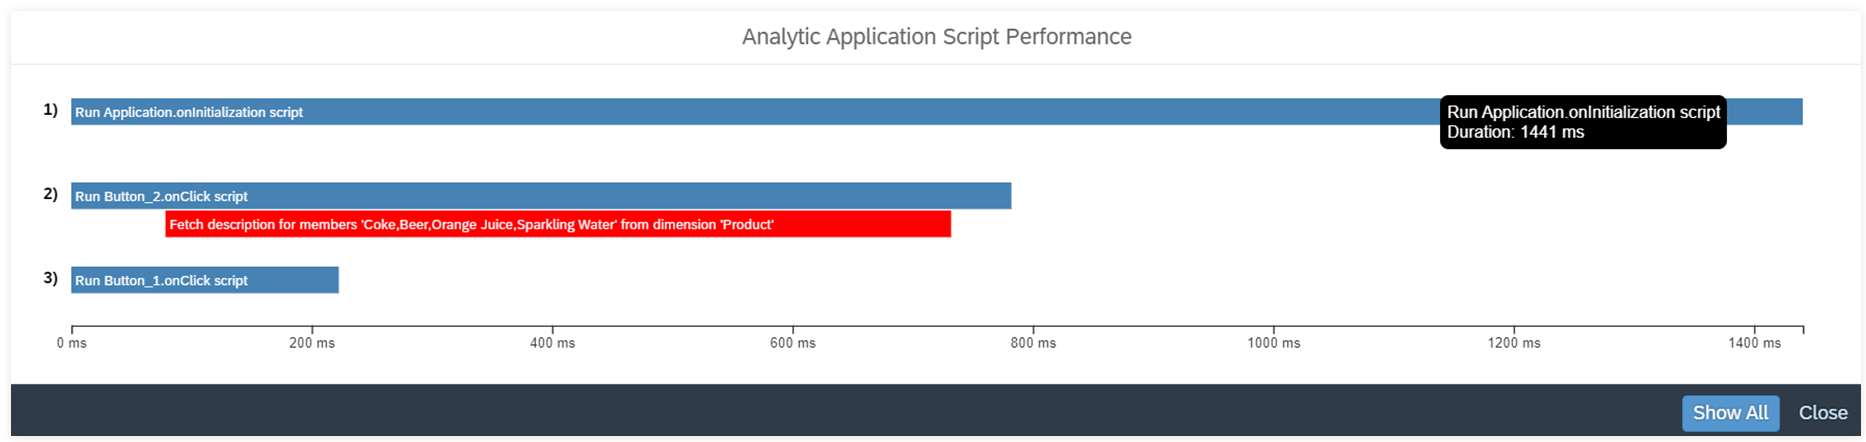
If there are some performance relevant events during the script execution, which can be ideally optimized by you as an application designer or story developer, they are displayed below the triggering event as separate red swim lanes with the same scale.
-
Waiting for [widget name] to be loaded in background means that a script tries to access a widget that is not loaded at the particular point in time. The scripts are in waiting position until the widget is loaded in the background. This can only be the case if background loading for widgets is used. To avoid the long waiting time for a widget, you can do one of the following:
-
Use the widget at a later point in time.
-
Set the widget to Always initialize on startup in the Styling panel.
-
-
Fetch description for member [member ID] from dimension [dimension ID] means that fetching description from the backend system for the member ID is necessary because only the member ID is used in setDimensionFilter API. To avoid fetching description, you can use a MemberInfo object such as {id:"some_id", description:"Some Description"} for filtering instead of only the member ID string.
To have a clearer view, you can hide some measurements by selecting the lanes. To refresh and show all measurements again, select Show All.