Debug Your Scripts
As an application designer or story developer, to find errors in your scripts, you can use the web browser’s developer tools to set breakpoints for debugging or use the debug mode in your analytic application or story.
Find Your Scripts in Web Browser's Development Tools
Before you start debugging your scripts, learn how to find and view them in the developer tools of the web browser, Google Chrome.
After you run the analytic application or story, open the web browser's developer tools. You need to run the scripts at least once during the current session so that you can find them there.
Before your scripts get executed at runtime, SAP Analytics Cloud transforms them. This is why the JavaScript in the web browser's developer tools doesn't look exactly the same as the scripts you wrote in the script editor during design time.
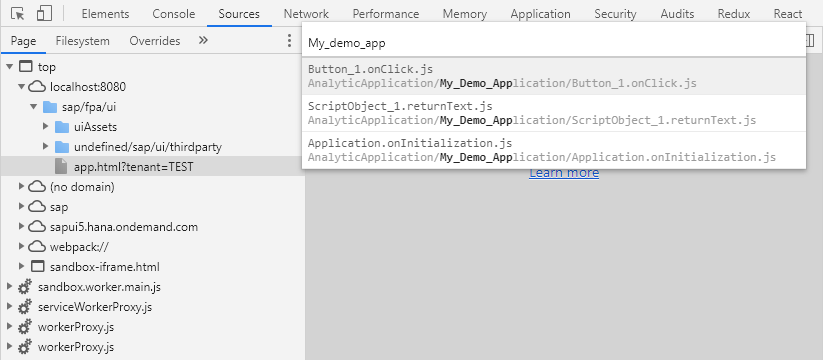
Then to search for scripts by name, press Ctrl + P to open the search field, and enter the name.
The names of the scripts follow a specific pattern: <WIDGET_NAME>.<FUNCTION_NAME>.js. The scripts are grouped in a folder named <APPLICATION_NAME>.
| Component of Script Name | Description |
|---|---|
| APPLICATION_NAME | The name that you set for your application or story when you saved it If you defined scripts for the onInitialization event, the WIDGET_NAME will be Application. |
| WIDGET_NAME | The name of the widget or element in your application or story |
| FUNCTION_NAME | The name of the function or event handler that holds the script you wrote |
Special characters in your application or story name will be replaced by _, except - and ., which will be kept as they are.
Let's assume you have an application called My Demo Application, which contains a button Button_1 with an onClick event handler.
The name of the script would be Button_1.onClick.js and it would be located in a folder called My_Demo_Application.
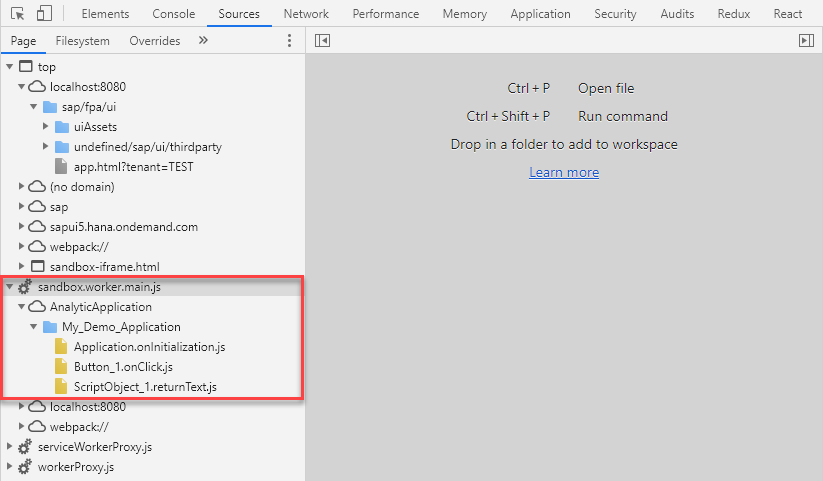
You can also find scripts by using the file tree on the left of the developer tools. Select the Sources tab. On the top level of the file tree, search for the entry that starts with sandbox.worker.main. Under AnalyticApplication, you'll find the folder with your application or story's name where there're all the scripts that you've already executed in the current application or story.
Set Breakpoints in Your Scripts
You can set breakpoints at certain points in your scripts to pause and check any errors.
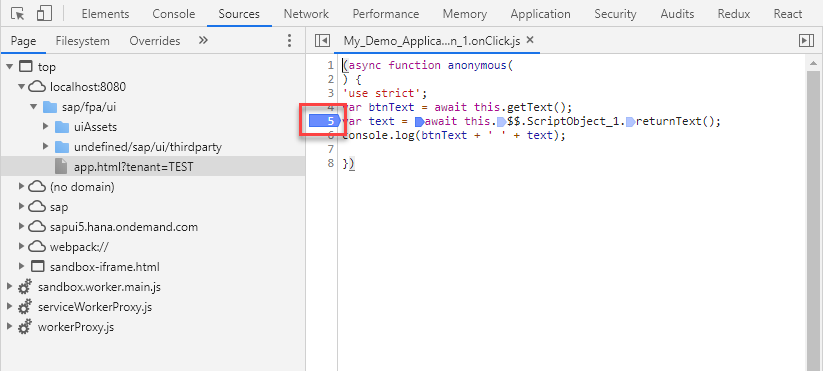
Open the scripts you want to pause during its execution, and to the left select the number of the line where you want to pause.
A blue marker indicates that the scripts will be paused here the next time they're executed.
You can add more breakpoints in the same scripts to pause at different points during runtime.
To reset a breakpoint, just select the marker you want to remove, and the scripts won't be stopped at this point.
Use SAP Analytics Cloud Debug Mode
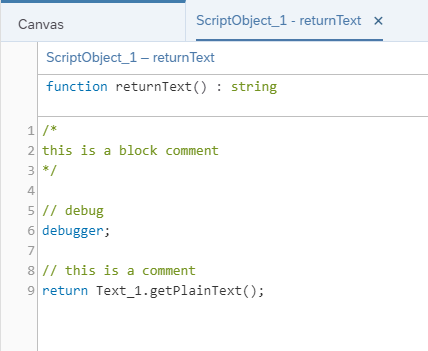
You can launch the SAP Analytics Cloud debug mode and use debugger; statements in your scripts, so that your scripts can automatically pause at multiple points during runtime for you to detect any errors.
Instead of setting breakpoints at runtime, at design time you can add the debugger; statements to your scripts.
Then, to launch the debug mode, at runtime add parameter debug=true to the URL.
https://<TENANT>/sap/fpa/ui/tenants/<TENANT_ID>/bo/application/<APPLICATION_ID>/?mode=present&debug=true
If the debug parameter receives a different value from true or no value at all, it's ignored and the debug mode isn't enabled.
When you run your analytic application or story in debug mode, the script will automatically stop its execution at the debugger; statements.
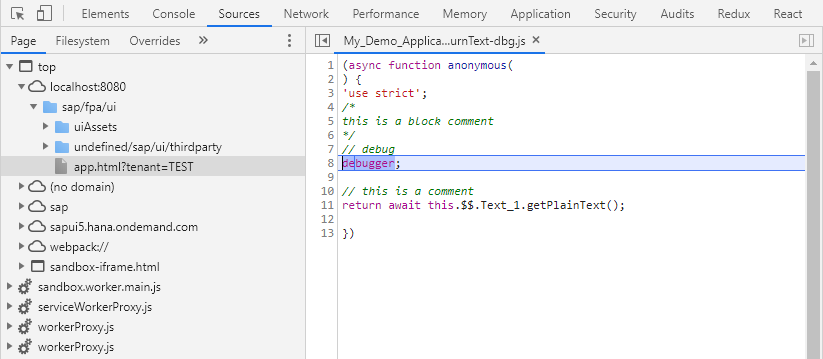
In debug mode, your script comments are generated into the transformed JavaScript. This helps you recognize your scripts in the web browser's developer tools.
The names of the scripts are generated differently in debug mode. All script names receive the suffix -dbg, for example, Button_1.onClick-dbg.js.