Work with Linked Widgets Diagram (Optimized Story Experience)
In edit time, after creating linked analyses and cascading effects in your story, you can open linked analysis diagram, which offers a graphic overview of the relationships among widgets. You can also add or remove widgets directly on the diagram to modify the existing relationships.
About Linked Widgets Diagram
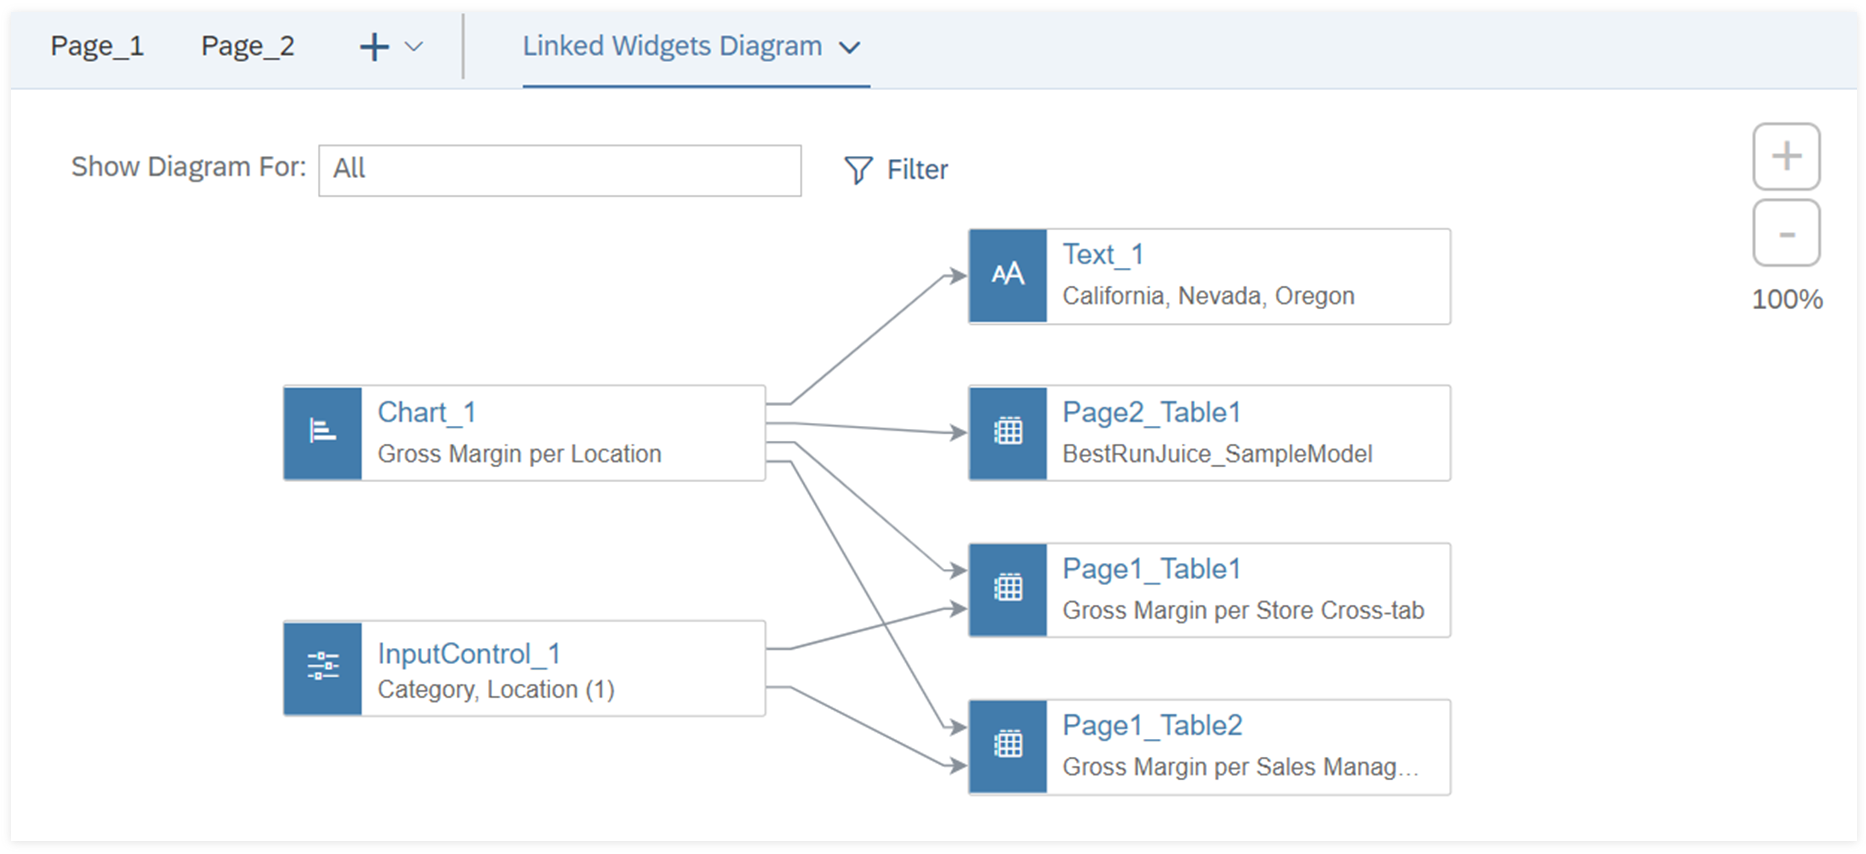
Linked widgets diagram is a graphic representation of interaction among widgets in the story, which you can drag, zoom in on and zoom out on to view how widgets affect each other. It helps to manage relationships especially when there’re many widgets in your story.
- Dimension member and measure-based input controls linked to charts, tables, R visualizations, geo maps, value driver trees and custom widgets
- Linked analyses among charts, tables, geo maps and custom widgets
- Linked analyses from charts, tables, geo maps and custom widgets to R visualizations, Dimensions dynamic text and images bound to data sources
- Filter lines linked to charts, tables and custom widgets
-
Cascading effects among dimension member and measure-based input controls
NoteMake sure cascading effect is turned on in the input controls’ context menu if you want to modify the relationships on the diagram.
The links created via scripting and widgets without data source aren't shown on linked widgets diagram.
Invisible widgets can be shown on the diagram but are grayed out.
In addition, this interactive diagram also lets you set linked widgets to a specific widget, which include:
- Source widgets, whose changes affect other widgets to rerender
- Target widgets, which are affected by changes in other widgets
To trigger linked widgets diagram, from Tools in the toolbar, choose Linked Widgets Diagram. For the first time to open, you can see an overview page with all the linked widgets in your story. When reopened during the session, the diagram stays in the previous state.
For a chart or table, you can also directly access the diagram via 

 Linked Analysis
  Diagram View. Then, you can see all its linked widgets.
Each widget on the diagram is represented by a node with widget icon, ID and, if applicable, full title and selected values.
Besides, when you hover over a link between the two widgets, you can see a tooltip indicating the relationship, either Linked Analysis, Filtering from Filter Line or Cascading Effect.
View and Manage Linked Widgets
With linked widgets diagram, you can both view and modify the existing widget relationships.
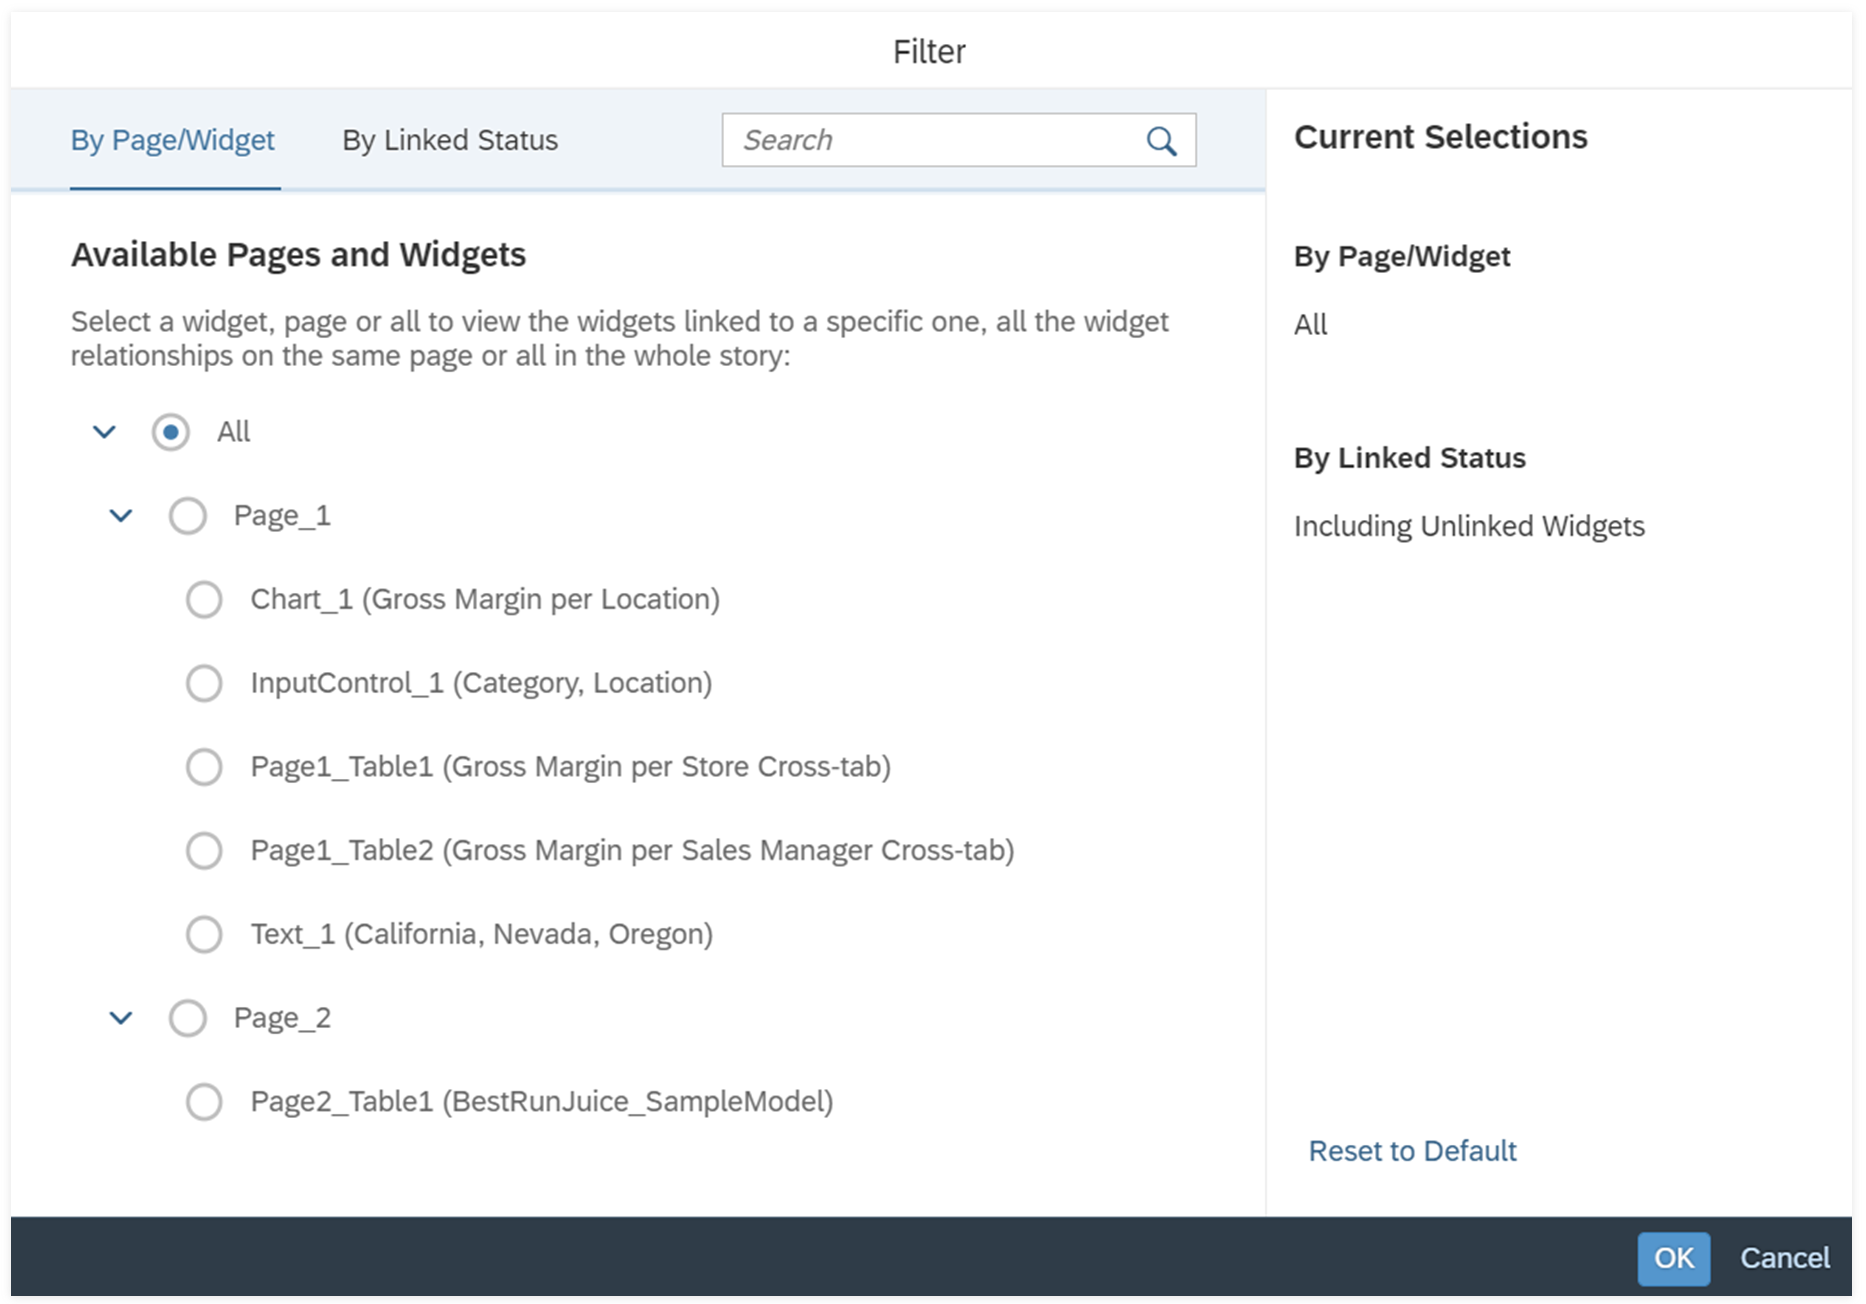
You can view widgets linked to a specific widget, all the widget relationships on a specific page, or all in the whole story. To do this, choose
 Filter. You can see a dialog where you can select a widget, a page or All as the scope.
At the same time, you can choose whether to show unlinked widgets as well.
Filter. You can see a dialog where you can select a widget, a page or All as the scope.
At the same time, you can choose whether to show unlinked widgets as well.
| Option | Description |
|---|---|
| Manage Linked Widgets | Manage linked widgets to the selected central widget. A panel opens where you can add or delete its source or target widgets (also available for all widgets in page or story overview). |
| View Linked Widgets | Switch to the selected source or target widget to view its linked widgets (also available for all widgets in page or story overview). |
| Remove Link | Remove the selected source or target widget from the existing relationship. |
| Switch to Page Overview | Switch to overview to view relationships among all widgets on the same page as the selected widget (also available for all widgets in story overview). |
| Switch to Story Overview | Switch to overview to view relationships among all widgets in your story (also available for all widgets in page overview). |
- Filter lines can only be source widgets.
- Only input controls can be input controls’ source widgets.
- Time series charts, waterfall charts and histograms can only be target widgets.
- Value driver trees don’t have target widgets, and only input controls can be source widgets.
- R visualizations don’t have target widgets.
Besides, when you hover over a central widget, you can select  on
either side to directly add its source or target widgets.
on
either side to directly add its source or target widgets.
When you're viewing all the widget relationships on a specific page, you can see an indicator on a widget if it's also linked to widgets on other pages. By choosing View All Linked Widgets in the tooltip, you can switch from page overview to focus on the widget.
While linked widgets diagram can visualize widget relationships across pages and on story level, only widgets on the same page and from the same data source are available for adding and managing linked widgets on the diagram.
For linked analysis applied to all widgets in the story, all the related links are displayed but not manageable on the diagram. For example, the Remove Link action from context menu isn't available.