Create and Use a Table with a Grid Layout
In SAP Analytics Cloud, your tables can consume data in a grid layout.
You may use Microsoft Excel in your daily work and are familiar with grid layouts of data. The following sections explain how you can use a grid layout on a canvas or responsive page.
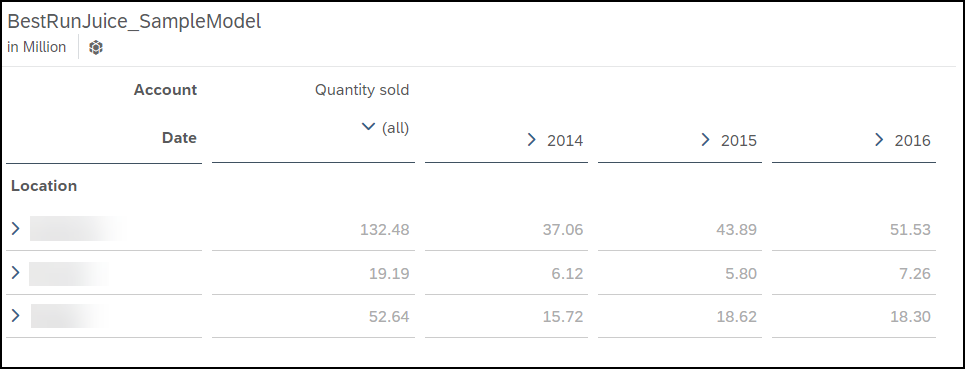
The following table does not show the grid layout:
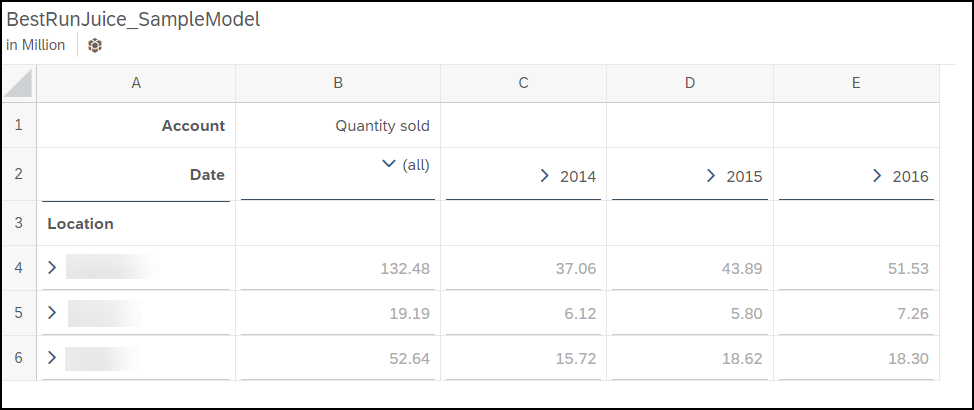
The following table shows the grid layout and column/row headers:
By using a table with a grid layout on a canvas or responsive page, you can make use of all available widgets in the story mode. For example, you can add other widgets, such as charts, images, and page filters on the same story page.
In Classic Story Experience, you can use a grid page, but you can't include other widgets such as charts on the page.
How to Create a Table with a Grid Layout
-
Create a canvas or responsive story page.
-
Add a table widget.
-
Select your table.
TipIf you created your story in Classic Story Experience, check that the Optimized Presentation option is selected in the
 Builder panel for your table.
 -
Open the contextual menu for your table by selecting
 (More Actions).
 -
Select
 Show/Hide.
 -
Select Grid and Column/Row Headers.
Use a Table with a Grid Layout
-
Adjust the number of columns and rows on your grid:
-
To add or remove columns, select
 (Add a new column) or
  (Delete a column) near the right
side of the table widget.
(Delete a column) near the right
side of the table widget. -
To add or remove rows, select
(Add a new row) or (Delete a row) near the bottom
border of the table widget.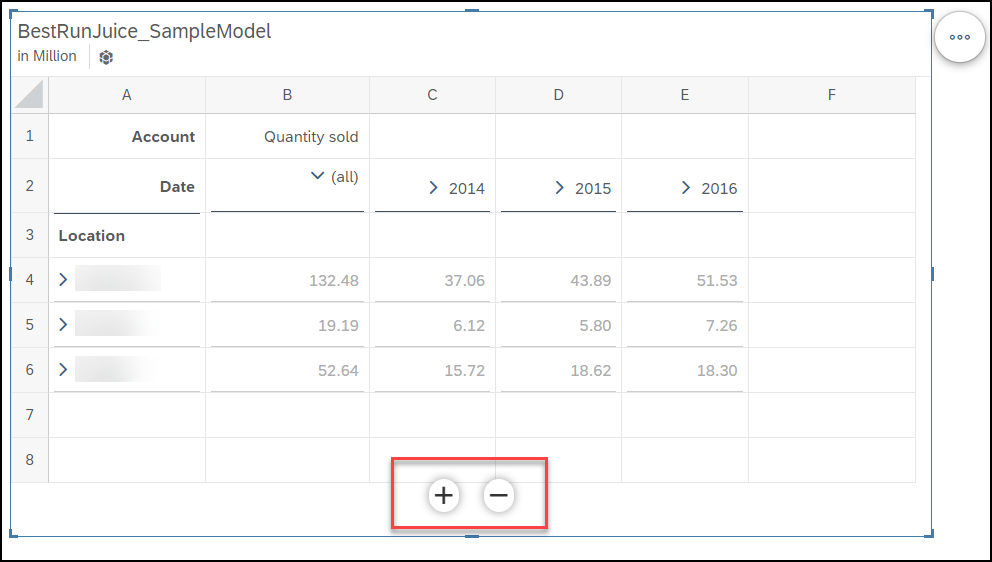
-
-
Maximize your table by selecting
 (More Actions)
 Fullscreen
 .
. -
Automatically resize your columns by selecting the Adaptive Column Width option in the
Builder panel for your table. -
Easily copy and paste values from your table to the grid.
-
Use the formula bar to add calculations to the grid.
ExampleThe following table uses the formula bar to calculate the total quantity sold across all locations in 2016:
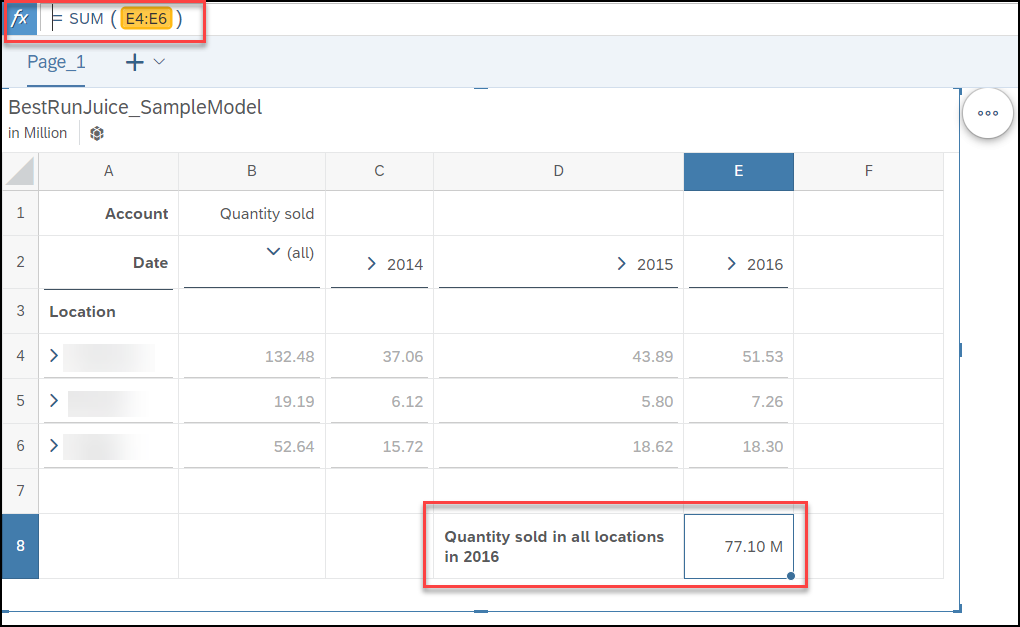
The calculation is added to the grid.