Best Practice: Switch Between Chart and Table
As an application designer or story developer, learn how to let viewers switch between a chart and a table by a toggle.
Prerequisites
-
You've already added a table and a chart widget and placed them on top of each other.
-
To follow this sample use case, use the model BestRun_Advanced as data source.
Context
To switch between the chart and table, you add one image that represents a chart and the other one that represents a table. Then you write scripts for each of the images so that when viewers click on the chart image, the chart appears and the table is hidden, and vice versa.
The default view time settings are to have the table visible and the chart invisible.
Procedure
-
Add the images you want viewers to click on when they toggle between chart and table.
For example:
 and
and  .
.-
Repeat the steps for the table image, and place the table image directly on top of the chart image.
When viewers click on the
chart image,
the table image appears in the same
place.
-
Repeat the steps for the table image, and place the table image directly on top of the chart image.
-
To enable the switch between table and chart, you need to edit the names and
then the scripts of both images. Change the name of the table
image to Switch_to_Table_display, and the name of the
chart image to Switch_to_Chart_display.
-
To edit the chart image's script, from the chart image's context menu, select

 Edit Scripts...
  onClick
 .
.
The script editor of this image's onClick event opens. Here, write a script that makes it possible to switch from the chart to the table.
-
Similarly, from the table image's context menu, select Edit Scripts... onClick.
Results
In view time, the application or story looks like this:
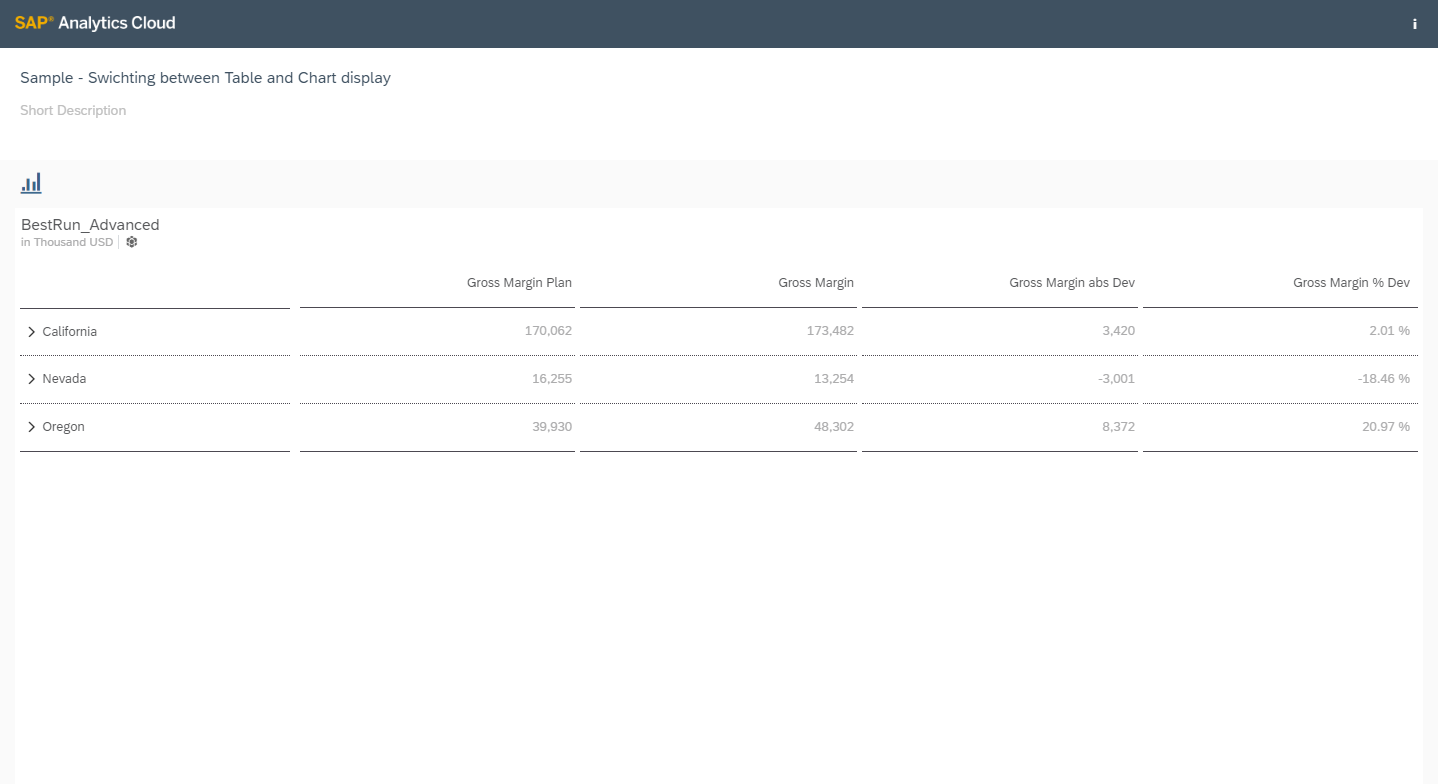
The table is displayed, because you've set it to be visible by default. When you click on the chart image, the chart appears instead of the table, and the image is changed to a
table icon:
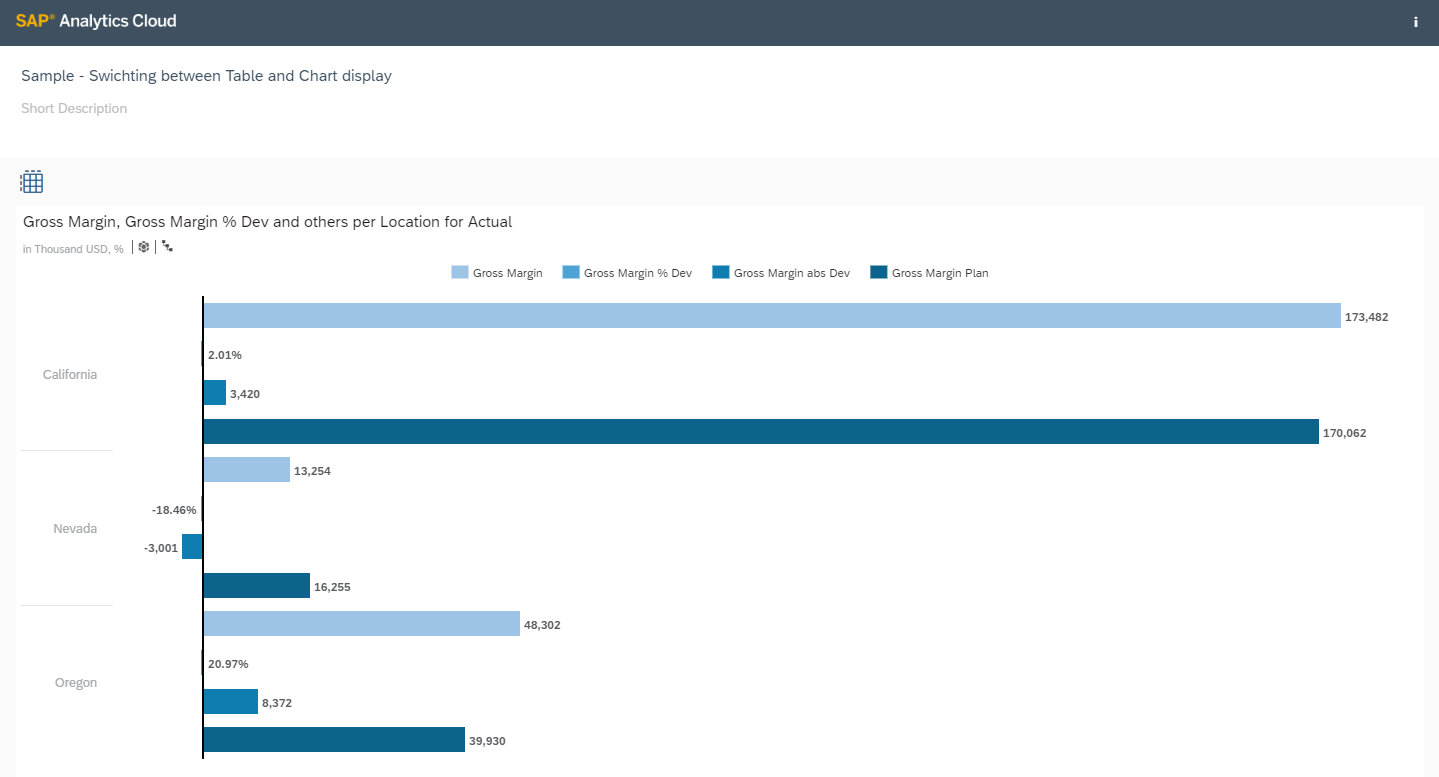
When you click on the table image, the table appears instead of
the chart, and the image is changed to a chart icon, back to the default view.