Set Up Value Driver Trees for Planning

Use a value driver tree (VDT) in SAP Analytics Cloud to visualize the entire value chain of your business, instead of looking at isolated KPIs.

When to use a value driver tree

You may want to take a driver-based approach to planning, where you identify key driver values and model their impacts on top-level metrics.

The drivers are usually figures that you can influence directly, like product prices, headcount, or travel expenses. They could also be external factors such as tax rates or raw material costs. Say you’ve modeled how these factors will impact the value of your business, for example, net revenue, gross margin, and total expenses.

In this case, you’ll need to see how value flows through your model. Like a table, a value driver tree shows numeric values, and supports data entry so that you can adjust the plan. However, it also shows hierarchical links between different values, and how the values are interconnected.

For example, if you increase marketing expenditures, you’ll expect your overhead costs and your sales volume to increase. In turn, you’ll see an increase in your sales revenue, and the cost of goods sold. A value driver tree lets you visualize these different links and see how your changes affect the bottom line.

How value driver trees work

Value driver trees let you pick which accounts or measures (depending on your model) and cross calculations to display in each node, and how to filter the node. Then, you can link nodes together to form a directed graph. You can also quickly expand or collapse different groups of nodes. This way, you get a streamlined look at the most important values, without any distractions.

Value driver trees are set up to compare values across time periods that you specify, so they can help with long term strategic planning, or focusing in on a forecast.

You also perform data entry by keypad, so value driver trees work well with touchscreen-based Digital Boardroom presentations.

Note

Previously, you created value driver trees in a separate designer outside of stories. These legacy value driver trees are no longer available, and any changes will not be saved. To transform existing legacy value driver trees to the new value driver tree in a story, see Transforming Legacy Value Driver Trees.

Adding a Value Driver Tree

Add a value driver tree (VDT) to your story or analytic application to visualize how values flow through your model, and to help you make strategic planning decisions and simulate different scenarios.

Prerequisites

Both planning and BI users can create value driver trees and enter data in them. Only users with planning licenses can publish changes to a version, however.

Context

You’ll start by picking your model. Then, you can add and configure nodes manually, or automatically based on the model’s structure. Finally, you’ll link the nodes to arrange them into a directed graph.

Each node shows at least one row of values. The rows contain a value for each time period that you include.

The row setup also depends on the combination of accounts or measures, and cross calculations that you add to the node. The following options are available:
Setup Options Description Example

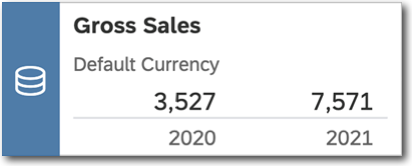
One account or measure + one cross calculation.

One account + measure. No cross calculation.

One measure. No account or cross calculation.

Displays a single row of values. The row title comes from the cross calculation name, if available, or the measure name.

If you select measures but no cross calculation, this will yield the same results as selecting the cross calculation Measure Values.

This setup keeps each node simple and helps emphasize the relationships between them.

A node showing gross sales in the default currency

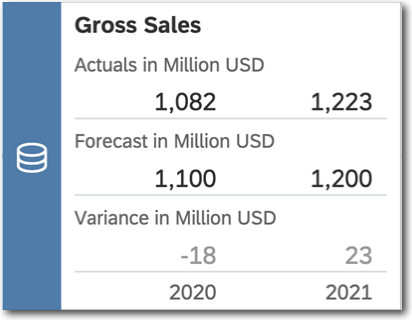
One account or measure + multiple cross calculations.

Displays a row for each cross calculation. The row titles come from the cross calculation names.

For example, a node could show different currencies, different scenarios, or actual and forecast values, including the difference between versions.

A node showing gross sales across different sales organizations using restricted measures

Multiple accounts or measures + one cross calculation.

Multiple measures + one account. No cross calculation.

Multiple accounts + one measure. No cross calculation.

Multiple measures. No cross calculation.

The node displays a different row for each measure or account. The row titles come from the account or measure names, depending on which has a larger amount.

If you select measures but no cross calculation, this will yield the same results as selecting the cross calculation Measure Values.

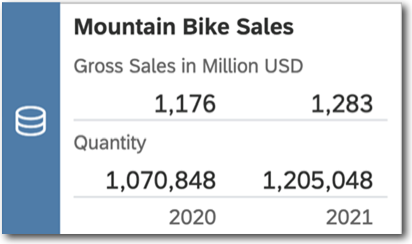
For example, you might add several nodes showing two interrelated measures, such as gross sales and sales quantity, and then filter each node to a different product or location.

A node showing gross sales and sales quantity for mountain bikes

If you select measures but no cross calculation on models that have no accounts, this will yield the same results as selecting the cross calculation Measure Value.

Displaying multiple measures and multiple cross calculations, or multiple measures and multiple accounts, at the same time isn’t supported.

By right-clicking in your value driver tree, you can open a context menu and perform actions such as removing, duplicating, or adding a node. To delete a value in your VDT, right-click on the value and choose Delete Value.

Procedure

  1. Add a value driver tree to your story page or analytic application canvas.
    • To add a value driver tree to a canvas, select Value Driver Treefrom the launch page or select Start of the navigation path Add Next navigation step Value Driver TreeEnd of the navigation path from the toolbar.
    • To add a value driver tree to a responsive page, select Start of the navigation path Add Next navigation step Value Driver TreeEnd of the navigation path from the toolbar.
    • To add a value driver tree to an analytic application, select Start of the navigation path Add Next navigation step More Widgets Next navigation step Value Driver TreeEnd of the navigation path.
  2. Select Create New Value Driver Tree and choose a model from the Based on list.

    The model needs to be an import data model. You'll usually want to choose a planning model so that you can do data entry, but analytic models with a Date dimension are available too.

    The value driver tree is added. You can right-click it for configuration, styling, and navigation options, including Undo and Redo. You can also use the Builder and Styling panel to set up your value driver tree.

  3. Add and configure the value driver tree nodes.

    There are three ways to add and set up nodes: manually, automatically, or by duplicating an existing node.

    Note

    Auto-create creates nodes based on either the account hierarchy and calculation structure in the model, or by measures and calculation structure in the model.

    • To add nodes automatically, select Auto-create Value Driver Tree from Model. Afterwards, you can edit, add, and remove individual nodes as required, or right-click and select Auto-create () to automatically add more nodes.
    • To add a single node, right-click the value driver tree and select Add Node (). Then change the node title to help you identify the values.
    • To duplicate an existing node, right-click on the node and select Duplicate Node ().

    Settings are available for individual nodes, as well as the default node configuration that applies to all nodes. If you’re adding nodes manually, it’s easiest to start with the default node configuration and then add nodes and change their settings as needed.

    As you set up nodes, you can use the Unlink from default node configuration () option for any setting that was inherited from the default node configuration. This way, you’ll keep that setting when you change the default node configuration.

    Depending on the configuration of your model, you can add two of the three options to a node: Accounts, Measures, and Cross Calculations.

    Setting Description
    Measure

    Select Add Measure and choose which measure to display. If multiple accounts or cross calculations have been added, you can select Set Measure to change the measure.

    Account

    Select Add Account and choose which account to display. If multiple measures or cross calculations have been added, you can select Set Account to change the account.

    It’s common to create value driver trees that show how values aggregate up through different accounts or measures, for example, from Salaries and Bonus Payments up to Employee Expenses. In this case, you’ll want to skip this setting for the default node configuration.

    Or you can show one account in multiple nodes, each with different filters.

    You can only use one account hierarchy within a node. If an account has already been added to the node, all other accounts will use the same hierarchy.

    When selecting accounts, you can also create a new calculated account based on the account dimension. For details about creating calculations in stories, see Create Custom Calculations for Your Charts or Create Custom Calculations for Your Tables.

    Cross Calculation

    Select Add Cross Calculation to add an existing cross calculation or create a new one. See Create Custom Calculations for Your Charts or Create Custom Calculations for Your Tables for details. If multiple measures or accounts have been added, you can select Set Cross Calculation to change the cross calculation.

    Like with measures and accounts, you might want to display the same cross calculations in all nodes, or change individual nodes. For example, your value driver tree might show measure values only, except the top level node which shows both measure values and variance values.

    Filter

    Here, you can filter the data or cross calculations. You can filter by any dimension but account, measure, or cross calculation.

    For example, to help strategize a global sales plan, you might set up a value driver tree that shows sales revenue in each node, filter each node by region, and then link them according to their aggregation.

    Range filters and member filters are available for date dimensions. Member filters are also available for other dimensions.

    By default, new value driver trees filter the version dimension to actuals and the presentation date dimension to the current year.
    • Version filters: Remove the version filter if you want to use restricted measures that show different versions, for example to show actual and forecast values. However, if you don’t either filter or restrict the version dimension, the different versions are aggregated together into a single value.
    • Date filters: Filter the date displayed in the value driver tree by member or by selecting a date range.

      Note

      Date dimensions using week granularity or custom time hierarchies can only be filtered by member.

      You can only change the date filter for the entire value driver tree, not for individual nodes.

      If you select a time range, the value driver tree uses a presentation date dimension to set the periods that display in each node. By default, it's the planning date dimension. It filters the values for each node, and it determines the time granularity and which periods are displayed for each node unless you specify a Presentation Date Range, too.

    Note
    • You can add calculations with input controls to let viewers customize the value driver tree. However, input controls that let viewers pick the measure, account or cross calculation aren't available.

    • Calculated dimensions and Difference From aren't available for calculations in a value driver tree.

    You can also apply filters to the entire widget, story, or page. A couple of restrictions exist:
    • Measure-based filters and filters on calculated dimensions won't affect the value driver tree.

    • Data entry isn't available when there's an advanced filter on the version dimension.

  4. If necessary, set the Presentation Date Range for the value driver tree.

    Value driver trees show different values for each time period that you include. It's easiest to set the time range by filtering the date dimension. In some cases, you'll also want to set a Presentation Date Range. For example, you might want to work with multiple date dimensions, or you might not want the date filter to match the time periods that the value driver tree displays.

    This setting determines the periods that are displayed for each node. To add one, open the default node presentation and expand Presentation Date Range. If you're using multiple date dimensions, pick the dimension that will set the displayed periods from the Date Dimension list. Then, select Add Presentation Date Range Filter and choose the range and granularity.

    You can also use no date filter to see the aggregated data for all time periods.

  5. After you’ve added and configured the value driver tree nodes, you can start creating links between them.

    The value driver tree flows from right to left. Hover over a node and drag and drop the left link icon () to link to a parent, or the right icon to link to a child. You can also add and remove parent and child links from the Relationships section for each node.

    Each node can link to multiple parents and children. However, you can’t set up cycles where a node is both an ancestor and a descendant of another node.

    Note
    Links are for visualizing data only, and don’t impact the calculation of node values.
  6. You can also drill into a node by a certain dimension, to split the node (and all its descendent nodes) based on dimension members.

    Right-click on a node, select Drill into from the context menu, select a dimension, choose one or more dimension members in the member selector dialog, and choose OK to confirm your choice.

    For each selected member, a new node will be created as a child of the selected node, with its title prefixed by and its value filtered by the corresponding selected member. The descendants of the selected node will be duplicated for each selected member and become the descendants of each new node, and values in nodes in all duplicated nodes are filtered by the corresponding selected member. Note that if you drill into a node without any descendants in the first place, only new child nodes will be created accordingly.

    Note

    The Drill into option is available in both view and edit modes. If you make changes in view mode, you need to switch to edit mode before you can save your changes.

  7. If you have a large value driver tree, you can condense the information by collapsing some of the nodes. Right-click a node and select Collapse Node to hide its descendants. You can expand the node again while viewing or editing the story.
  8. Open the Styling panel to set up colors, borders, and other styling options. If your value driver tree has longer node titles, you can specify a Minimum Node Width on this panel to make sure that the entire title is visible.

Results

When you’re finished building your value driver tree, you can save your story or analytic application, begin using it, or share it with other users.