Best Practice: Filter Table and Chart Through Cascaded Filtering
As an application designer or story developer, learn how to let viewers filter on dimensions and then according to hierarchies (such as flat presentation and category) to display the data.
Prerequisites
-
You've already added a table and a chart widget and placed them on top of each other.
-
To follow all functions of this sample use case, you've completed the exercise Best Practice: Switch Between Chart and Table and can now enhance your analytic application or optimized story.
Context
You'd like to add two dropdowns, one for filtering on dimension and the other for filtering on hierarchy. The dropdown for the hierarchy filter changes according to the chosen dimension. There's always one consistent option for hierarchy, which is Flat Presentation, and there might be only this or more options depending on the chosen dimension. Viewers can add different filters by selecting from the dropdown lists.
Procedure
-
In the Outline panel, hover over Dropdown_Hierarchies, and select
 . In the script editor, write the following script for
the onSelect event of the dropdown:
Sample Code
. In the script editor, write the following script for
the onSelect event of the dropdown:
Sample Codevar sel = Dropdown_Hierarchies.getSelectedKey(); // set hierarchy for Table Table.getDataSource().setHierarchy(CurrentDimension, sel); // set hierarchy for Chart Chart.getDataSource().setHierarchy(CurrentDimension, sel);
This script gets the selected value of the dropdown list and accordingly sets the hierarchy of the table and the chart when the script variable CurrentDimension is referenced, so that the hierarchy dropdown displays the filtered options.
-
In the Outline panel, hover over Dropdown_Dimensions, and select . In the script editor, write the following script for
the onSelect event of the dropdown:
Sample Code
var sel  = Dropdown_Dimensions.getSelectedKey();
// Table
Table.removeDimension(CurrentDimension);
Table.addDimensionToRows(sel);
//Chart
Chart.removeDimension(CurrentDimension, Feed.CategoryAxis);
Chart.addDimension(sel, Feed.CategoryAxis);
// write filter information into the browser console
console.log( ['CurrentDimension: ', CurrentDimension ]);
console.log( ['Selection: ', sel ]);
// save the current selection (dimension) into a global variable
CurrentDimension = sel;
// get hierarchies from the current dimension
var hierarchies = Table.getDataSource().getHierarchies(CurrentDimension);
var flag = true;
// remove all current items form the Dropdown_Hierarchies
Dropdown_Hierarchies.removeAllItems();
// loop
for (var i=0;i<hierarchies.length; i++){
 if (hierarchies[i].id === '__FLAT__') {
 Dropdown_Hierarchies.addItem(hierarchies[i].id, 'Flat Presentation');
 }
 else {
 Dropdown_Hierarchies.addItem(hierarchies[i].id, hierarchies[i].description);
  if (flag === true) {
   var hierarchy = hierarchies[i].id;
   flag = false;
  }
 }
}
// write hierarchy information to browser console
console.log( ['Hierarchy: ', hierarchy ]);
console.log( ['Current Dimension: ', CurrentDimension ]);
// set Flat Hierarchie als Default
Dropdown_Hierarchies.setSelectedKey('__FLAT__');
// Table
Table.getDataSource().setHierarchy(CurrentDimension, '__FLAT__');
// Chart
Chart.getDataSource().setHierarchy(CurrentDimension, '__FLAT__');
This script gets the selected option from the dimension dropdown and saves it in a variable sel.
-
All the dimensions are removed from the table and chart and replaced with the selected dimension.
-
All the hierarchies are removed from the table and chart. The hierarchies available to the selected dimension are got from the data and loaded in the hierarchy dropdown list.
-
Flat Presentation is set as the default hierarchy.
-
-
In the Outline panel, hover over Canvas (for analytic applications) or the relevant
page (for optimized stories), and select

 onInitialization
 . Write the following script:
Sample Code
. Write the following script:
Sample Code// get hierarchies from the current dimension var hierarchies = Table.getDataSource().getHierarchies(CurrentDimension); var flag = true; // loop for (var i=0;i<hierarchies.length; i++){ if (hierarchies[i].id === '__FLAT__') { Dropdown_Hierarchies.addItem(hierarchi es[i].id, 'Flat Presentation'); } else { Dropdown_Hierarchies.addItem(hierarchi es[i].id, hierarchies[i].description); if (flag === true) { var hierarchy = hierarchies[i].id; flag = false; } } } // write hierarchy information to browser console console.log( ['Hierarchy: ', hierarchy ]); console.log( ['Current Dimension: ', CurrentDimension ]); // set Flat Hierarchie als Default Dropdown_Hierarchies.setSelectedKey('__FL AT__'); //Table Table.getDataSource().setHierarchy(CurrentDimension, '__FLAT__'); //Chart Chart.getDataSource().setHierarchy(CurrentDimension, '__FLAT__');With this script, on initialization all the available hierarchies of the dimensions are loaded, and Flat Presentation is set as the default option of the hierarchy dropdown. The script is the same as a part of what happens when a dimension is chosen.
Results
When you run the application or story, it looks like this:
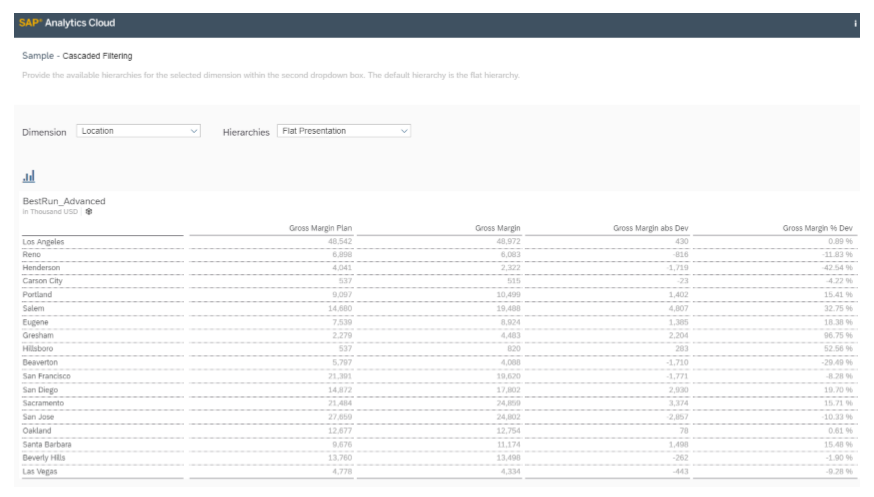
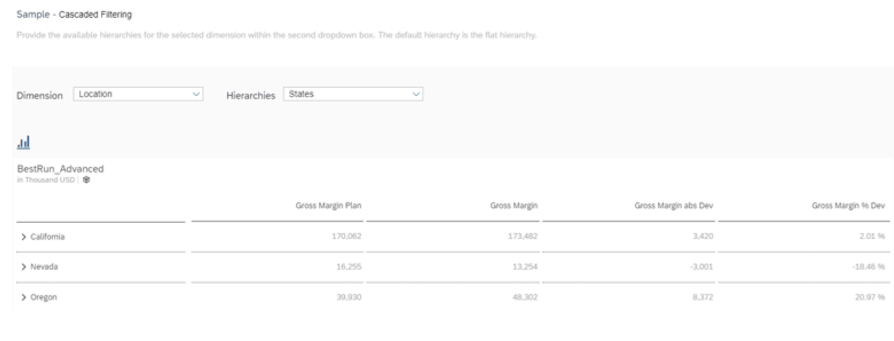
If you keep the dimension Location and change the hierarchy to States, the table displays location in state hierarchy instead of flat presentation.
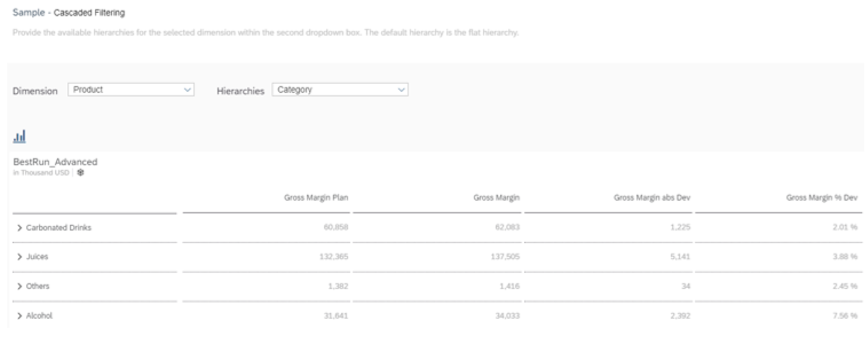
If you change the dimension to Product, and the hierarchy dropdown list changes accordingly. You can select Category, and products are displayed in categories.