Subscribe to and View Data Change Insights
As an application user or story viewer, you can subscribe to top N data change insights in an analytic application or optimized story to auto-discover significant data changes of specific charts on a regular basis.
About Data Change Insights
Data change insights can also be triggered when there’re value changes across thresholds, value changes across reference lines and top N member changes. For different types of data changes, different chart types are supported:
| Data Change Types | Supported Chart Types |
|---|---|
| Value change | Bar/column, combination column & line, combination stacked column & line, stacked bar/column, waterfall, line, stacked area, bubble, cluster bubble, scatterplot, heat map, radar, tree map, bullet, numeric point, pie, donut, marimekko |
| Value change across thresholds | Bar/column, combination column & line, combination stacked column & line, stacked bar/column, line, stacked area, bubble, cluster bubble, scatterplot, radar, bullet, numeric point, marimekko |
| Value change across reference lines | Bar/column, combination column & line, combination stacked column & line, stacked bar/column, line, stacked area, bubble, scatterplot, radar, marimekko |
| Top N member change | Bar/column, combination column & line, combination stacked column & line, stacked bar/column, waterfall, line, stacked area, bubble, cluster bubble, scatterplot, radar, bullet, numeric point, marimekko |
Data change insights can only be triggered automatically, after the onInitialization event completion and before the PDF generation.
Application or story designers need to enable Data Change Insights for the whole application or story and individual charts, so that viewers can make daily, weekly or monthly subscription and configure value range to trigger data change insights. Related APIs are supported. For more information, see Enable Data Change Insights and Use Related APIs.
Data Change Insights is under the license of scheduling. If you’re an admin, refer to Configure Scheduling of Publication.
Subscribe to Data Change Insights
In view time, you can subscribe to data change insights of your analytic application or optimized story to keep informed and track of data changes on a regular basis.
Before subscription, make sure that specific charts are included. From  Data Change Insights in a chart's
  (More Actions) menu, you can change its subscription mode to Subscribed: Normal
Importance (default), Subscribed: High Importance or Unsubscribed. You
can also set a value range to be included in or excluded from triggering data change insights there via Set Subscription
Range. The value range can be either for a specified measure or all measures, and use either fixed value or delta
value.
(More Actions) menu, you can change its subscription mode to Subscribed: Normal
Importance (default), Subscribed: High Importance or Unsubscribed. You
can also set a value range to be included in or excluded from triggering data change insights there via Set Subscription
Range. The value range can be either for a specified measure or all measures, and use either fixed value or delta
value.
To subscribe to data change insights, from Tools in the toolbar, select
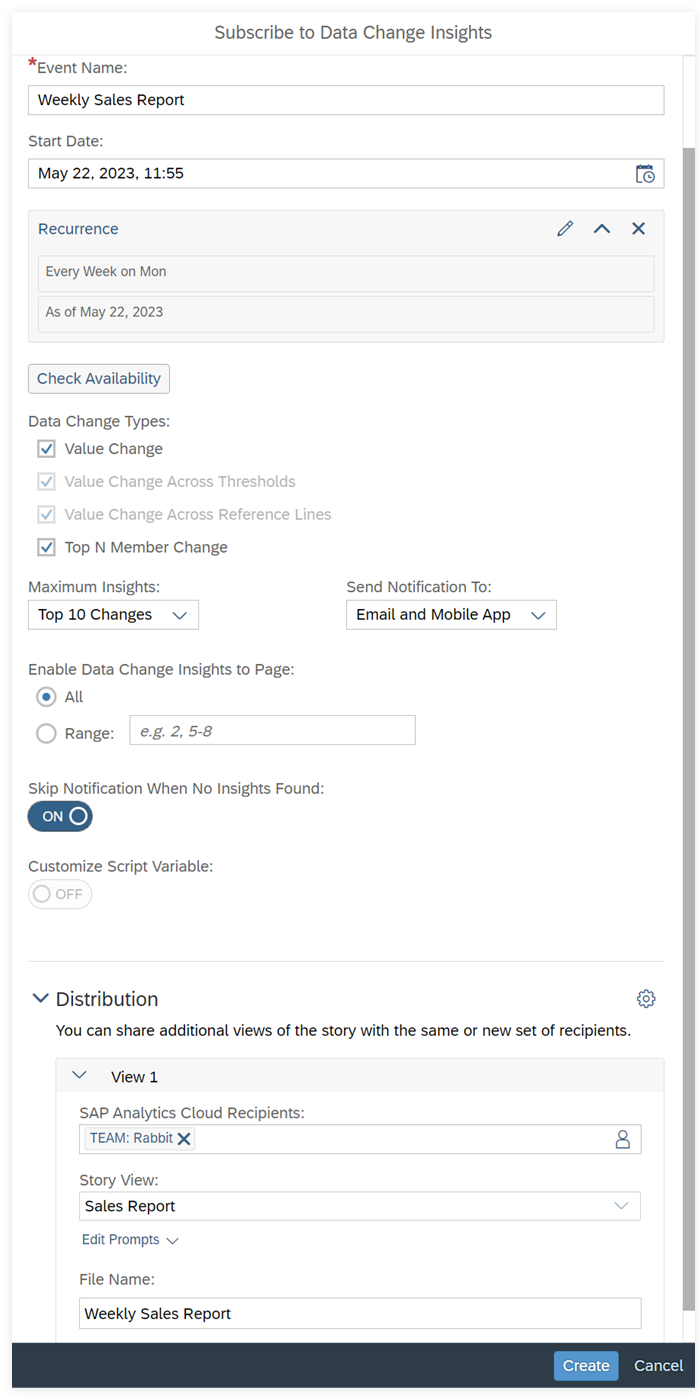
Subscribe to Data Change Insights. The subscription dialog appears.
in the toolbar, select
Subscribe to Data Change Insights. The subscription dialog appears.
-
Event name (by default the application or story name)
-
Start date or recurrence, including recurrence pattern (day, week or month), frequency, start date and end date
NoteData change insights are triggered by day as the smallest unit. Therefore, if the recurrence pattern is by day, recipients won't receive notifications when there’re data changes within a day, while they can only compare changes between two different dates.
-
Data change types
You can select the following data change types to be included in the subscription: Value Change, Value Change Across Thresholds, Value Change Across Reference Lines, Top N Member Change.
-
Maximum of insights (by default 5, no more than 10)
-
Sending notifications to email or mobile app, or both
-
(Only available in Optimized Story Experience) Pages
You can specify the pages to be included in the subscription. By default All is selected.
-
Skipping notifications when no insights found
-
Script variables (if applicable)
-
Distribution
By default the current user and the application or story name are the recipient and PDF file name respectively. You can select other SAP Analytics Cloud users or teams as the recipients. Only one application or story view is allowed per subscription, and you can edit the prompts for it.
After subscription, a calendar event is created. If you want to unsubscribe, you can go to Calendar to remove the event. You can also change the subscription settings there.
Notifications will then be sent within the configured period via:
-
Emails (one with data change insights, the other with a PDF attachment of the corresponding analytic application or story)
-
SAP Analytics Cloud notifications
View Data Change Insights
Besides viewing data change insights of individual analytic applications or stories via email and system notifications, you can view all of your data change insights across applications and stories on your SAP Analytics Cloud home screen.
First, you need to add the data change insights tile to your home screen. Go to your user profile, select Home Screen Settings, and switch on Data Change Insights.
There’re two display modes in the data change insights tile:
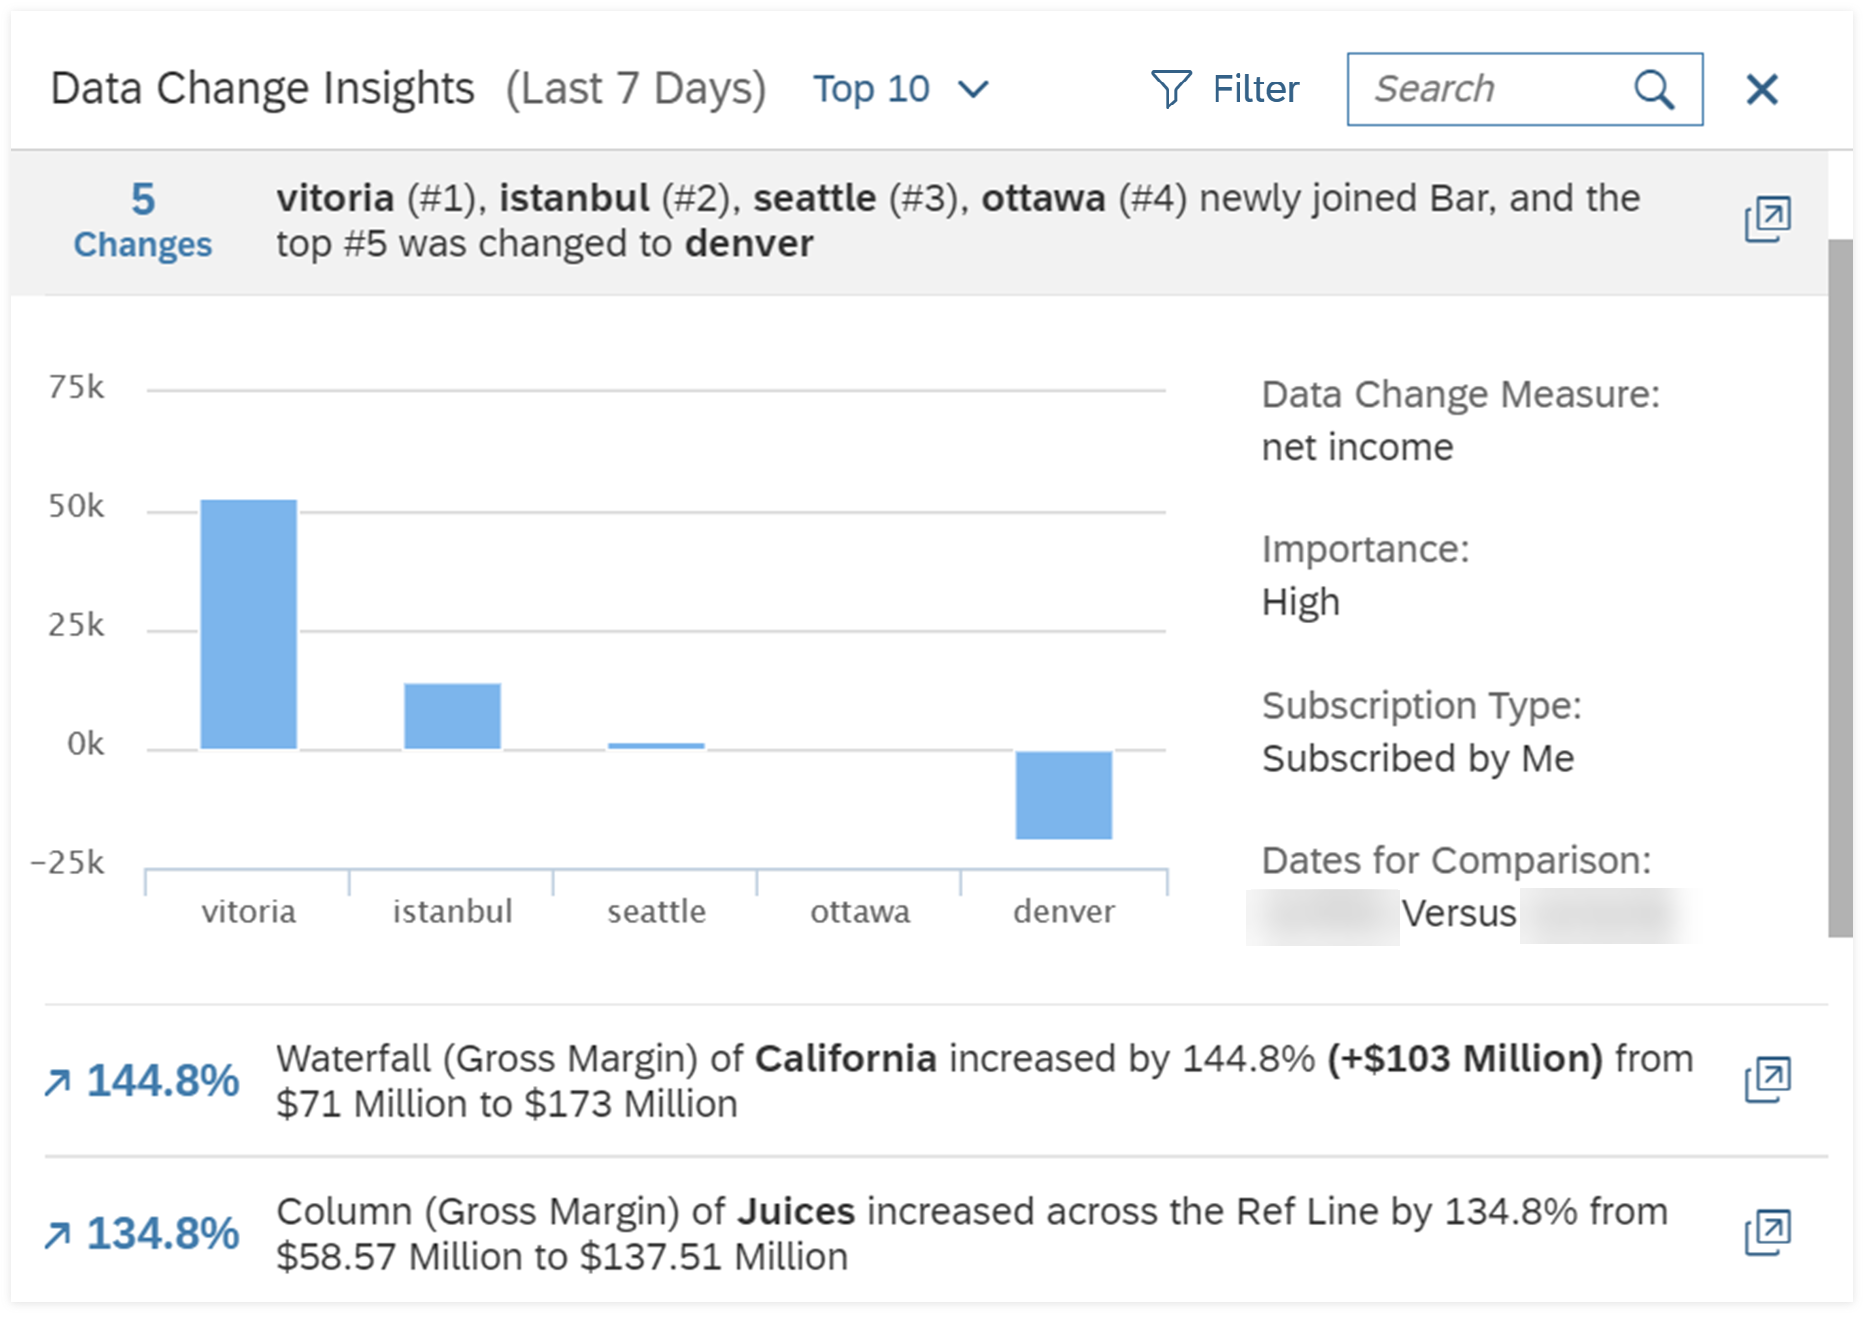
- Top N (by default top 10): Displays top N data change insights across applications and stories. From the dropdown menu you can customize the number of insights to be shown on the top N list, ranging from 1 to 20.
- Notifications: Displays all the data change insights by date. You can see how many data increases, data decreases and top N member changes happened within a certain period and expand to view all the insights.
The tile can display a maximum of 50 data change insights.
Furthermore, you can filter all the data change insights by time range (by default last seven days), importance (by default all) and subscription type, Subscribed by Me (default) or Shared with Me.
Your tile display settings will be lost if you refresh the home screen.
The tile is resizable. In the enlarged tile, you can search by keywords to find the insights.
You can select each insight to view more detailed information, including data change measure, importance, subscription type and dates for comparison.
Special Cases
-
On application or story level, no date changes insights are generated and users get a warning if:
-
The application or story gets modified during subscription period.
-
The application or story view is a different one.
-
The model variables from the URL parameter are changed.
-
-
On chart level, the comparison within a chart is ignored if:
-
A chart's model variable is changed.
-
A chart's filter is changed (except for dynamic datetime filter).
-
A chart's calculated measure's referenced script variable is changed.
-