Best Practice: Filter Table and Chart Through Dropdown (Single Selection)
As an application designer or story developer, learn how to let viewers filter on a table or a chart by selecting a single measure from a dropdown widget.
Prerequisites
-
You've already added a table and a chart widget and placed them on top of each other.
-
To follow all functions of this sample use case, you've completed the exercise Best Practice: Switch Between Chart and Table and can now enhance your analytic application or optimized story.
Context
The dropdown widget lists all the measures of your data source, which acts as measure filter. When viewers select a measure from it, the filter is applied to both table and chart.
Procedure
-
To define what happens when users select a value from the dropdown, create a script object. In this object, write a function that
sets the measure filter according to what the user has chosen from the dropdown.
-
To rename the folder, hover over ScriptObject_1, and select

 (More)
  Rename
 . Enter Utils.
-
To rename the function, hover over function1, and select (More) Rename. Enter setMeasureFilter.
-
Select the function setMeasureFilter, and when the Script Function panel
opens, select
 (Add
Argument).
(Add
Argument).
-
To write the script for the function, hover over the function setMeasureFilter, select
 (Edit Scripts). Enter
the following script in the script editor:
Sample Code
(Edit Scripts). Enter
the following script in the script editor:
Sample CodeTable.getDataSource().removeDimensionFilter("Account_BestRunJ_sold"); if (CurrentMeasureFilterSelection !== "") { Chart.removeMeasure(CurrentMeasureFilterSelection, Feed.ValueAxis); } Table.getDataSource().setDimensionFilter("Account_BestRunJ_sold",selectedId); Chart.addMeasure(selectedId, Feed.ValueAxis);With this script you define what happens to the table and the chart when users select a measure from the dropdown. The existing filters applied to the table and chart are removed and replaced with captured values.
-
To rename the folder, hover over ScriptObject_1, and select
-
To define how to pass the captured value to the setMeasureFilter function, write script for the
onSelect event of the dropdown widget. Hover over the dropdown widget in Outline,
select (Edit Scripts), and
enter the following script:
Sample Code
Utils.setMeasureFilter(Dropdown_Measures.getSelectedKey());
This script gets the selected value of the dropdown and passes it to the setMeasureFilter function as parameter.
-
To define what happens when the analytic application or optimized story is first run, write script for the
onInitialization event of the application or story page. In Outline hover over
Canvas (for analytic applications) or the relevant page (for optimized stories), select (Edit Scripts) onInitialization, and enter the following script:
Sample Code
var measures = Table.getDataSource().getMeasures();
var selectedKey = "";
if (measures.length > 0) {
 	for (var i=0;i<measures.length; i++){
        // Measure
		Dropdown_Measures.addItem(measures[i].id,measures[i].description);
		if (selectedKey === "" && i === 0) {
			selectedKey = measures[i].id;
			Dropdown_Measures.setSelectedKey(selectedKey);
			console.log(["selectedKey ", selectedKey]);
		}
		console.log(["CurrentMeasure ", measures]);
	}
}
Utils.setMeasureFilter(selectedKey);
With this script you can make sure that on initialization, all the available measures of the table are loaded into the dropdown. The first measure in the list is the selected value and filter.
Results
Your application or story looks like this when opened in view time:
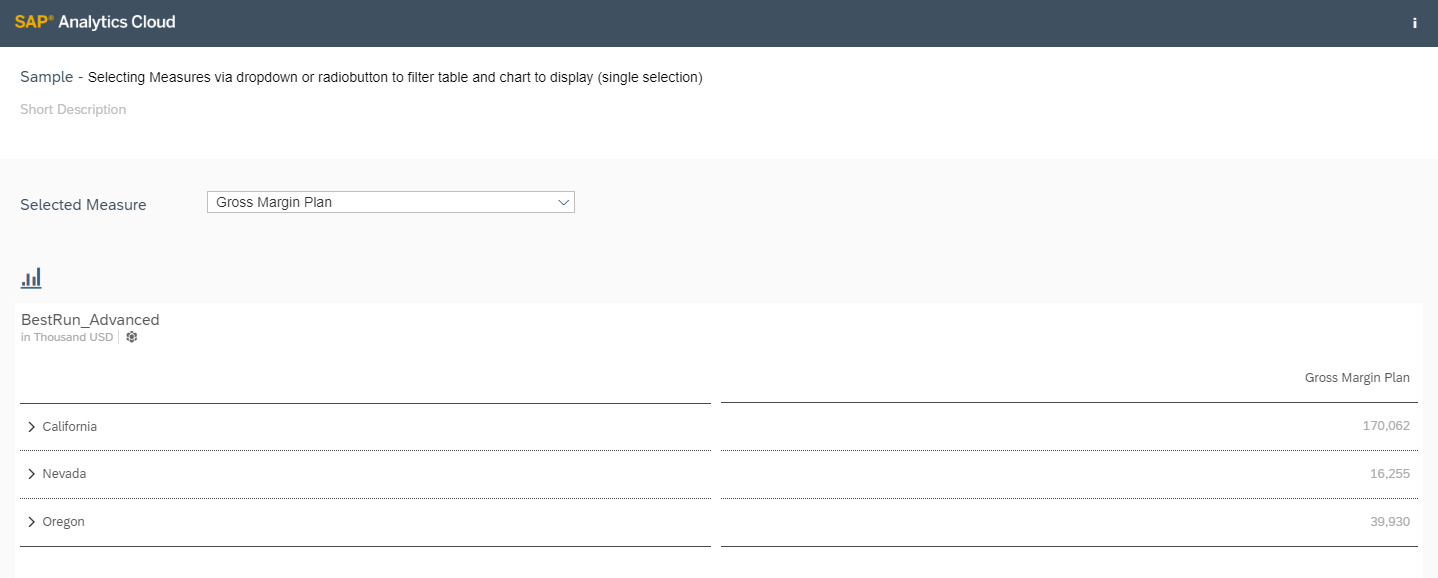
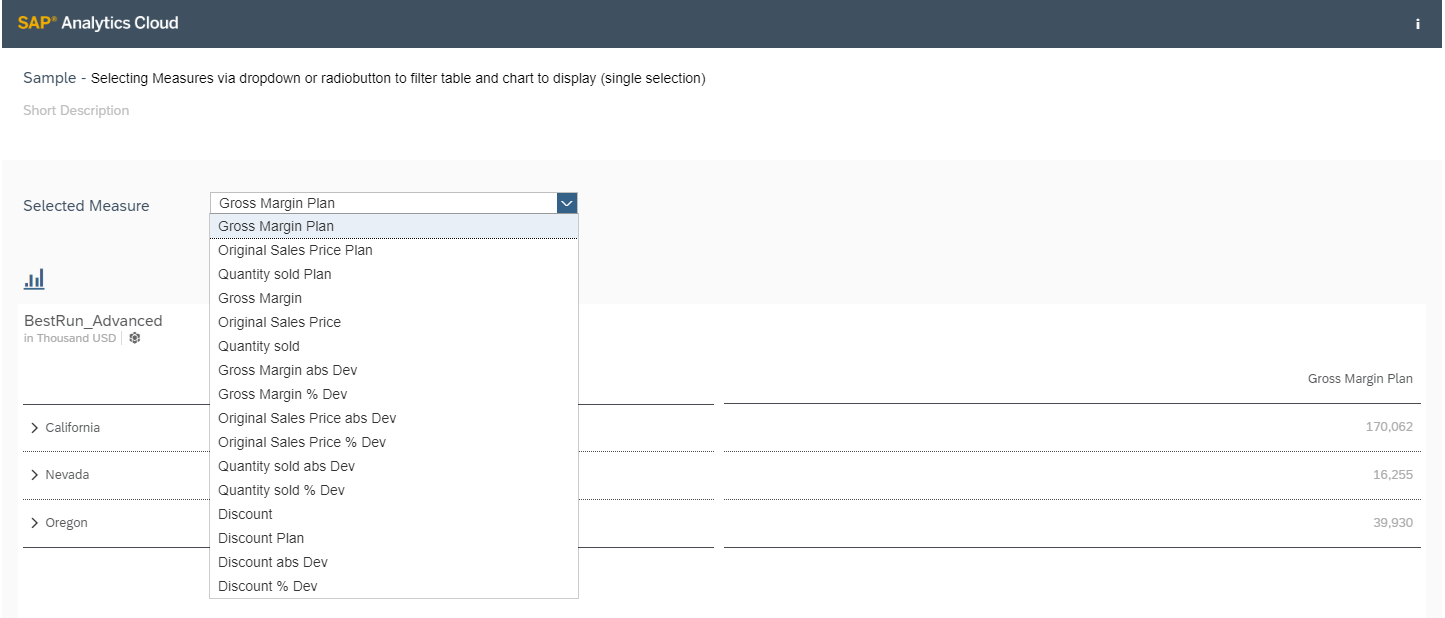
You can select a measure from the dropdown list to filter on the table:
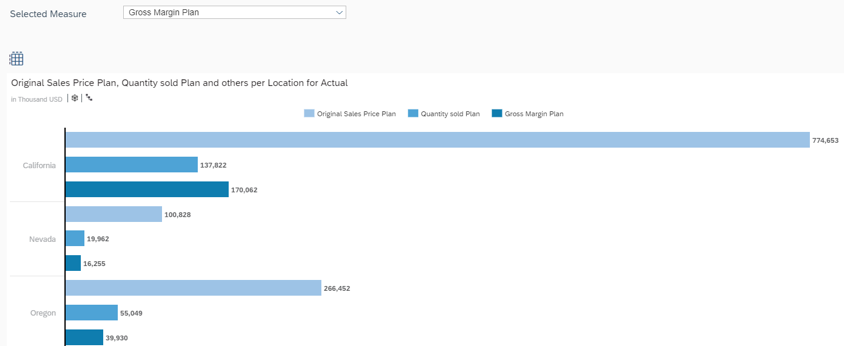
You can select  to switch to the chart:
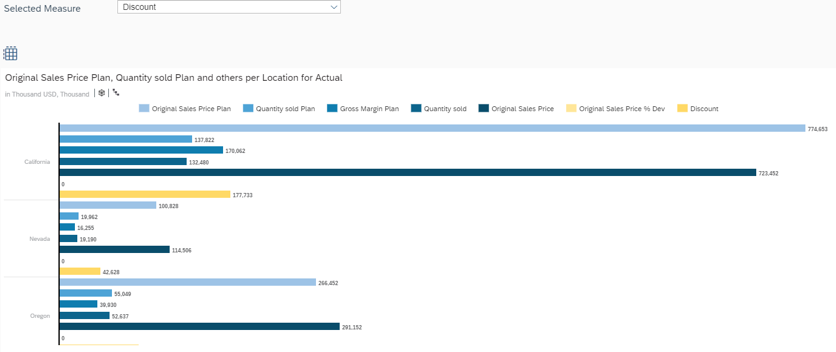
The measure selected from the dropdown filters on the chart as well. When you select Discount, the chart looks like this: