Monitor System Usage
Use the monitoring reports and data available in the Monitor tool to assess the current health of your SAP Analytics Cloud service, identify problems, and plan for the future needs of your organization.
- Users with Read and Update permissions for System Information.
- Admin and BI Admin standard application roles.
Get to Know Monitoring
Monitoring lets you as an administrator answer the important question How is our tenant being used? Knowing what your capacities are, such as the number of licenses in use or the amount of storage space consumed, is essential to making informed decisions on how to allocate resources.

 System
 Monitor
 , and offers a variety of charts and reports for gaining insights into
the state of your system. The tool includes the following tabs:
, and offers a variety of charts and reports for gaining insights into
the state of your system. The tool includes the following tabs:- Overview - Keep track of your current license usage, with historical charts on how those licenses are being used during logged in sessions, and system information.
- Trace - A log of recorded system messages you can use to identify and troubleshoot issues.
Let's dive deeper into each of these to show you how you to use the information to successfully maintain your system.
Overview
The Overview tab has several charts to help you visualize how your licenses are being consumed over time.
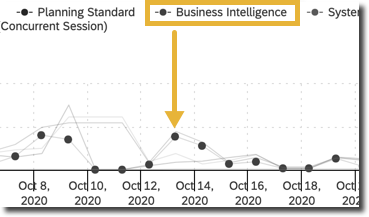
The Historical Usage charts allow for some interaction. Change the time frame of the data being displayed by using the sliding scale features or choose a zoom level ranging from one month to all historical data. You can also click a particular license type in the legend to highlight the relevant data points in each chart.
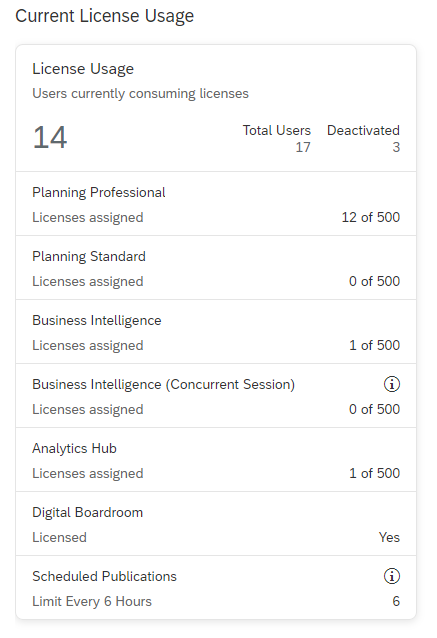 |
The Licenses chart shows you a count of how many licenses are currently assigned for each license type in your tenant. You can see the maximum allowed licenses, and whether or not you are over or under this maximum. You can also see the total number of users you have on your system as well as how many are deactivated. Deactivated users do not consume licenses. For more information, see Modify Users. Tip
If Business Intelligence User (Concurrent Session) License Count shows 0, don't be alarmed! Unlike the other named user license counts, concurrent sessions are counted differently. This is the real-time value and shows the number of concurrent users using your system right now. This chart also specifies whether or not your system has the SAP Digital Boardroom. The SAP Digital Boardroom does not consume licenses, and this will be a simple Yes or No value. The number of total licenses you have also is a factor in how many story publications can be scheduled on your tenant in a given hour - this calculated number is displayed on the chart. |
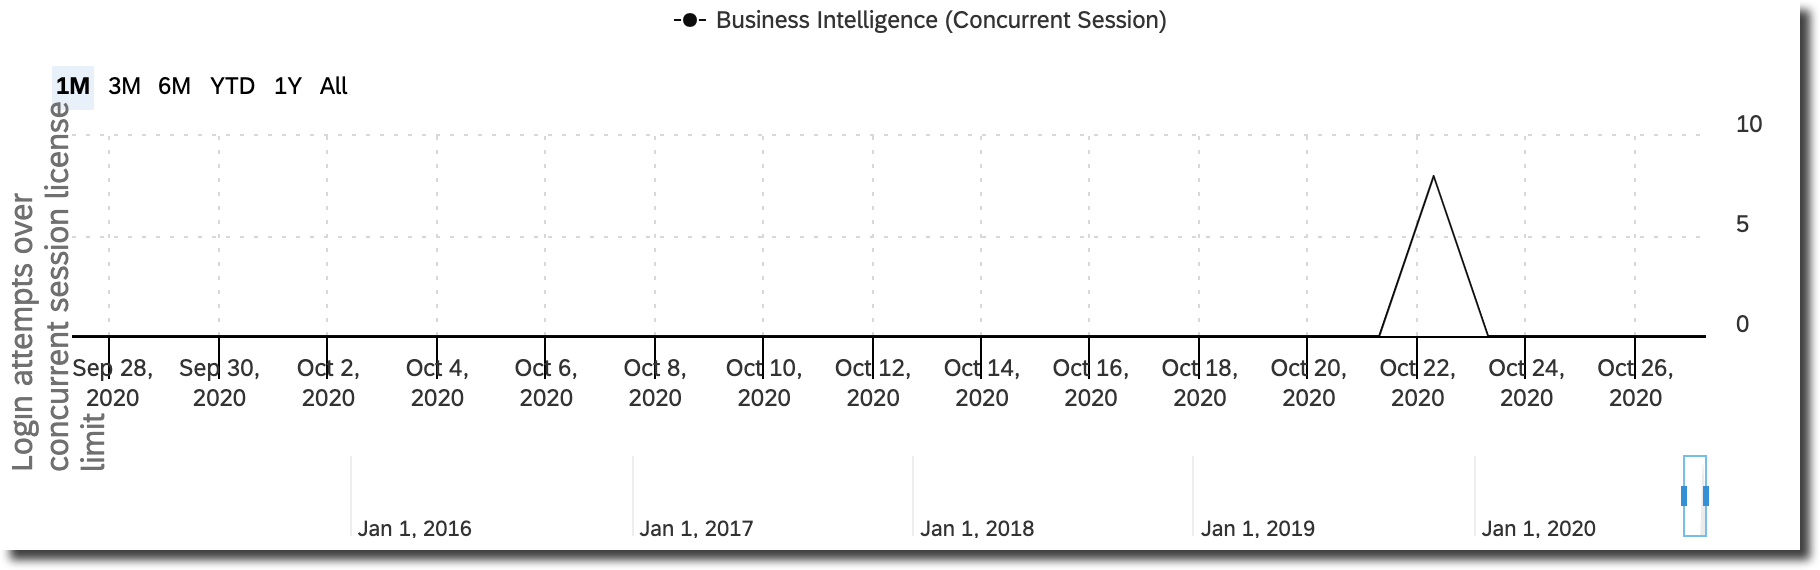 |
The Login attempts over concurrent session license limit chart is a historical graph showing the number of login attempts made when all concurrent sessions were in-use. When this happens, the user that attempts to sign in receives a message: No Sessions Available. All concurrent session licenses on this system are in use. Please try to log on again later, or contact your system administrator to increase the number of available sessions. Use the graph to see how often your users are prevented from signing in, and whether you need to increase your number of concurrent session licenses to accommodate the usage in your organization. |
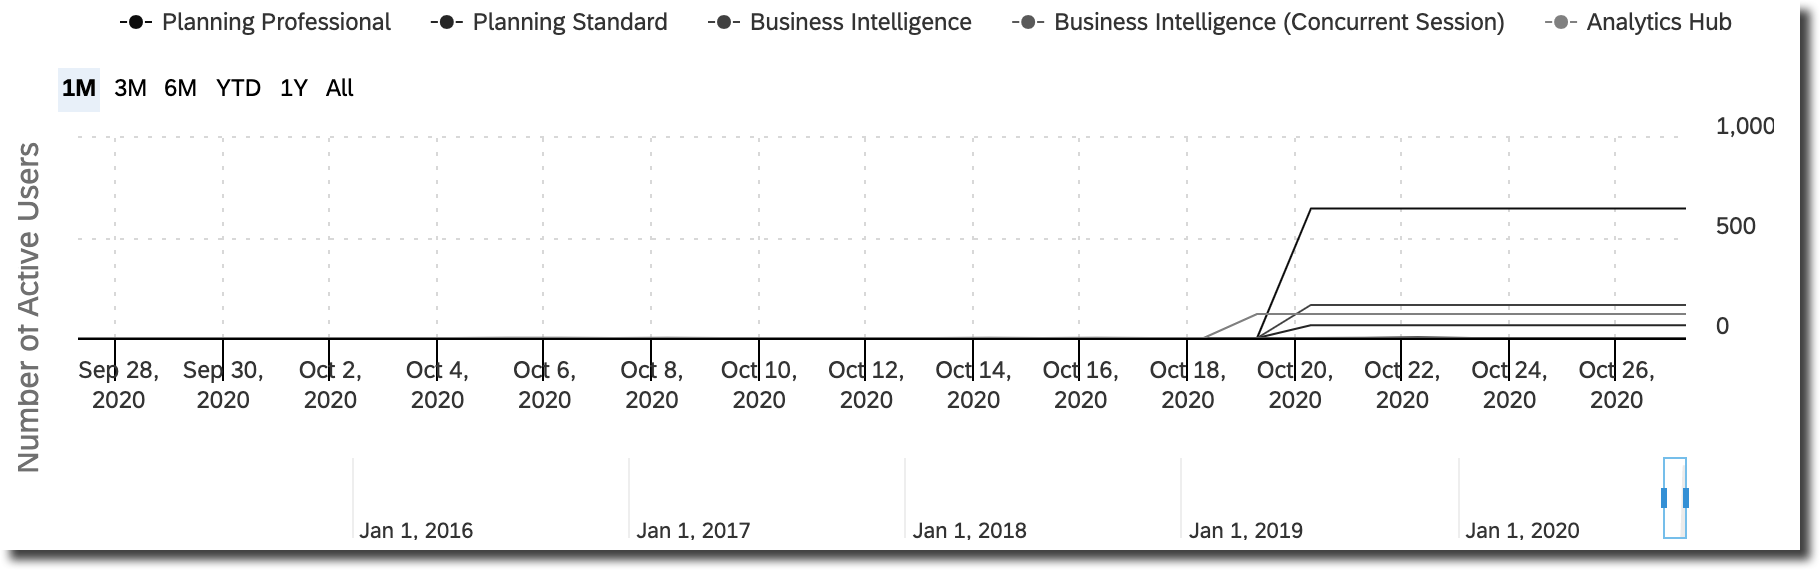 |
The Number of Consumed Licenses chart is a historical graph showing the number of named user licenses assigned or concurrent licenses actively logged in. This chart is a historical view of the Licenses chart. |
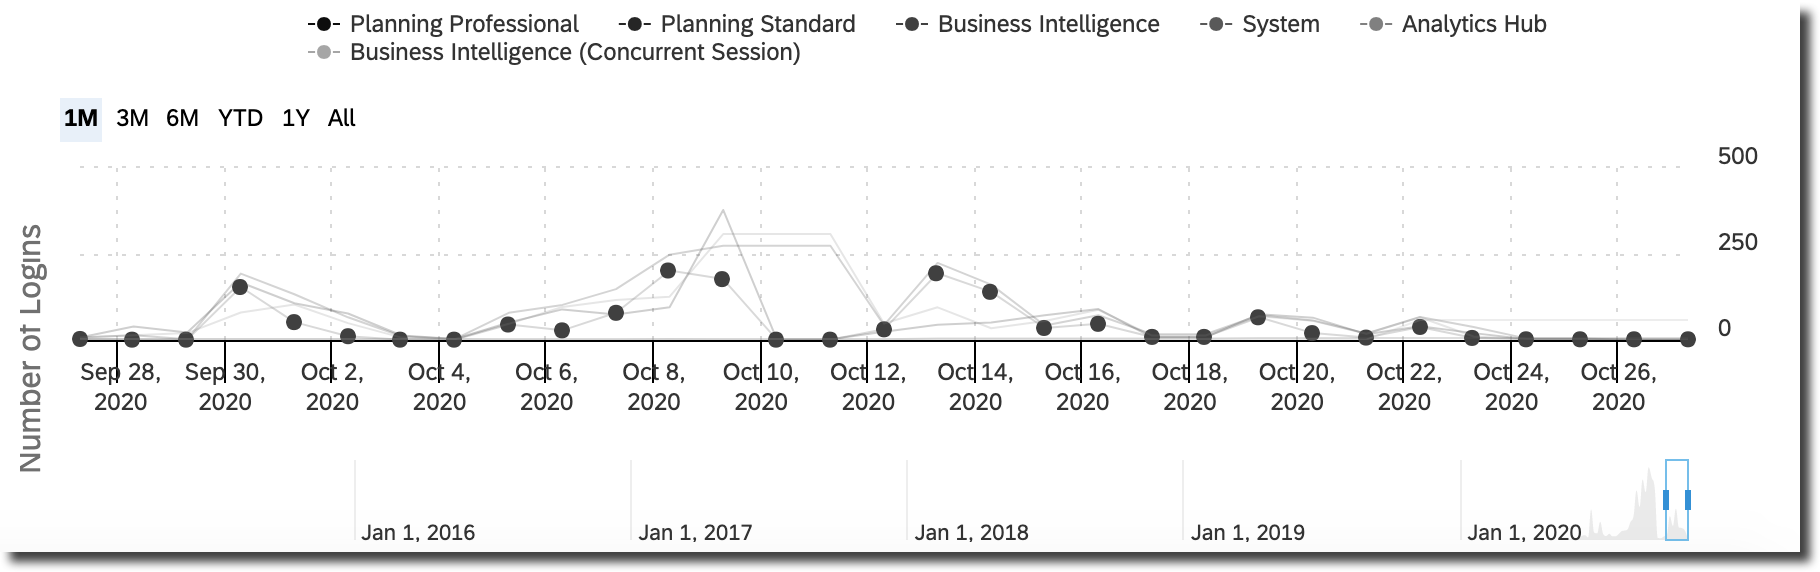 |
The Number of Logins chart is a historical total count of logins that shows you the login trend over time. |
Trace
The Trace tab contains a table of the trace log messages that are recorded for your service. You can view the trace logs to help with troubleshooting errors, and in particular provide SAP with important information when you need to create an incident and get SAP support.
System  Administration System Configuration.
 The Search and  Filter features are useful tools for working with the log file to
narrow down the visible messages. The Search feature operates
on the User Name, Component, and
Message columns and filters the items listed on screen to
those that include a match with the search string you type. The
Filter feature allows you to enter a date range to select
only log entries within a fixed period of time. Additionally, most columns of the
display are sortable using a
Filter features are useful tools for working with the log file to
narrow down the visible messages. The Search feature operates
on the User Name, Component, and
Message columns and filters the items listed on screen to
those that include a match with the search string you type. The
Filter feature allows you to enter a date range to select
only log entries within a fixed period of time. Additionally, most columns of the
display are sortable using a  Sort
Descending or
Sort
Descending or  Sort
Ascending feature in the column headers.
Sort
Ascending feature in the column headers.
|
Name |
Description |
|---|---|
| Time-stamp |
The date and time value for each message. |
| Trace Level |
Log messages are categorized on the basis of a severity level and the system administrator can set which levels of message are displayed. Typically only Errors (trace level 4) are visible. |
| User Name |
This column shows the ID of the user account that generated the message. |
| Component |
Where relevant, the technical component name is shown here. |
| Message |
The text of the error message. If the message text is truncated, use the mouse pointer to hover over the message to read the text in a tool tip. |
| Correlation ID |
Include this Correlation ID when you report an error to SAP. It will help us track down the cause and resolve your incident more quickly. For details on how to enter an SAP Support incident, see Get More Help and SAP Support. The Correlation ID is saved with error logs, but it isn't a code that corresponds to a specific error. Instead, it's a unique identifier generated by the system to help us trace what the system was doing when the error occurred. |
| Detail |
Additional information for the error may be displayed here. |
The log file is limited to a maximum of 350,000 rows of data. The oldest log entries
will be deleted to maintain this limit. You can also manually delete log entries by
selecting the  Delete. In the Delete System
Trace dialog, you can choose to remove all log entries, or remove
entries older than a specified time period.
Delete. In the Delete System
Trace dialog, you can choose to remove all log entries, or remove
entries older than a specified time period.
Next Steps
Now that you have an understanding of how to monitor usage, you may also be interested in
reviewing performance metrics for your SAP Analytics Cloud service.
For example, comparing how expensive different models and stories are, and their
impact on overall service performance. To get started, check out the SAP Analytics Cloud Performance Analysis
Tool .
.
You can also get monitor system usage, and get more detailed information using the System Overview tool. For more information, see Use the System Overview