The Lorenz Curves
Check [1-Sensitivity] or Specificity against the population using the Lorenz Curve.
- [1-Sensitivity], where Sensitivity is the proportion of the actual positive targets that have been correctly predicted,
- Specificity, which is the proportion of actual negative targets that have been correctly predicted..
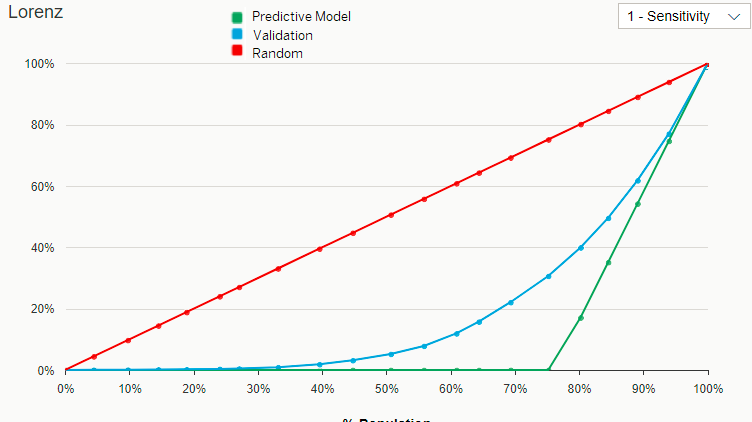
How to read the [1-Sensitivity] curve?
The [1-Sensitivity] curve also known as the "Lorenz Good" displays the cumulative proportion of false negative targets with regard to the selected population threshold.
The X Axis shows the percentage of the population ordered from the lowest to the highest probability. The Y Axis shows the [1-Sensitivity], that is [1- the proportion of positive targets classified as True Positive]. This is equivalent to the proportion of the missed positive targets.
The results are ordered from the lowest probability (on the left) to the highest probability (on the right).
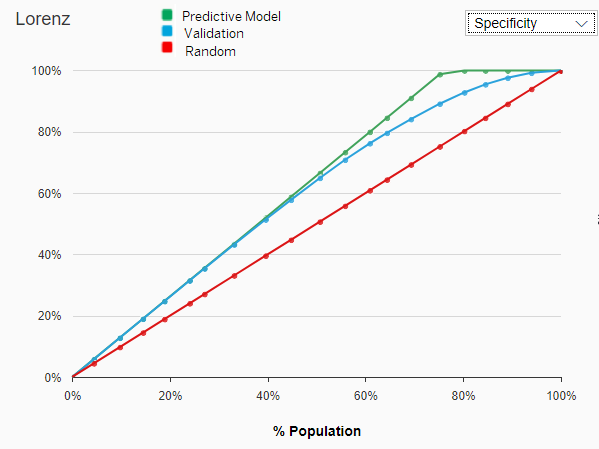
How to read the Specificity curve?
The Specificity curve, also known as the "Lorenz Bad " curve, displays the cumulative proportion of actual negative targets that have been correctly predicted with regard to the selected population threshold.
The X Axis shows the percentage of the population ordered from the lowest to the highest probability whereas the Y Axis shows the Specificity.
Examples of Lorenz Curves
- The positive targets would represent the population with a high risk: this population should not be granted a credit.
- The negative targets would represent the population with a low risk: This population could be granted a credit.
For the following examples, we will consider a threshold set at 80% of the population with the lowest probability that the customers cannot reimburse the credit.

- A "random predictive model" (that is no predictive model) would not identify 80% of the population with a high risk (= population that should not be granted a credit).
- A perfect predictive model would not identify 17% of the population with a high risk (= population that should not be granted a credit).
- The predictive model created by Smart Predict (the validation curve) would not identify 40% of the population with a high risk (= population that should not be granted a credit).

- A random predictive model would classify 80% of the population with a low risk as True Negative (= population that could be granted a credit).
- A perfect predictive model would classify 100% of the population with a low risk as True Negative (= population that could be granted a credit).
- The predictive model created by Smart Predict (the validation curve) would classify 93% of the population with a low risk as True Negative (= population that could be granted a credit).