Create Custom Calculations Within Your Table
You can add calculated rows and columns to your table, or even create calculations and formulas within the table.
There may be situations where you prefer to add calculations directly to the table rows or columns and you can do that for less complex calculations.
However, if you want to create calculated or restricted measure calculations or other complex calculations, you will need to access the Builder panel and create those calculations using the Calculation Editor.
For more information, see Create Custom Calculations for Your Tables.
The types of calculations that you can create are limited by where you are trying to create them, whether that is by using the Calculation Editor or by creating a calculation directly within the table. Within the table, you may see different calculation types available for rows or columns, or outer or inner dimension members.
When you copy or duplicate a table that has custom calculations (row or column calculations), the new table uses the same calculations as the original table, not copies of those calculations.
If you want to use different custom calculations in your new table, you need to remove the current calculations from that table and then create new ones.
Add Calculated Rows and Columns
While you can still create calculated members based on the Account or Cross Calculations dimensions using the Calculation Editor, creating calculated rows and columns can provide more flexibility. For example, you don't really need to create a restricted measure to calculate the variance between an Actual and a Budget version.
Repeating: uses one dimension member and the calculation appears wherever that dimension member appears.
Single: uses multiple dimensions in the calculation and appears only once.
How to Add a Calculated Row or Column
-
To add a blank row or column, right-click the header of a dimension member and select
 Add column (or Add row) and then select either
Repeating or Single.
Add column (or Add row) and then select either
Repeating or Single.The calculated row or column is created as a new member of the same dimension and hierarchy level as the member that you selected.
-
(Optional) Type a name for the calculation in the header cell.
-
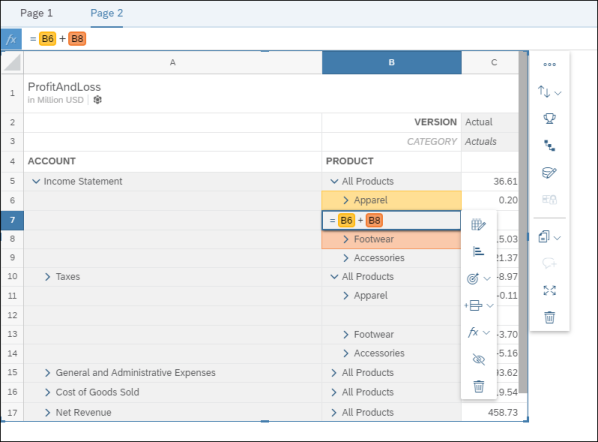
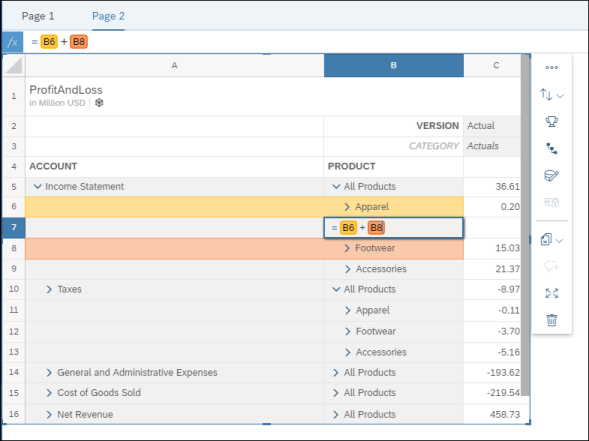
To enter the formula, type the equals sign (=) and then begin typing the formula.
-
Add cell references by typing the coordinates of the cell (for example, B2), or by selecting the cell to reference.
The cell must belong to the same table as the calculation.
-
References to cells in a calculated row or column are relative.
For example, if you type =C2-B2 in a column header, the fifth row of this column will calculate C5-B5, the sixth row will calculate C6-B6, and so on.
-
Create absolute or fixed references to cells.
For example, if you want to multiply each row by the value in C2, you type =$C$2*B2.
-
The following are some of the most common formulas that you can create.
Formula Example Sum =B2+C2 Subtract =B2-C2 Multiply =B2*C2 Divide =B2/C2 Percentage difference =(B2-C2)/C2 Percentage share =B2/C2 Power: a column raised to a power =B2^3 -
Apply the =comment() function to create a comment column.
For example, you can add a reference to a column header (=comment(B2)) to create and display comments for the data cells in that column. (When you export the data to a CSV file, you can also export the comment column.) Double-click a cell or select it and start typing to work with comments.
For more information about commenting on data cells, see Adding Comments to a Data Cell.
-
-
To edit, format, or delete a calculated row or column, open the Builder panel and expand the list of calculations for the dimension that the row or column was added to.
The calculated rows or columns are referred to as Story Calculations in the builder panel. When you select a story calculation and choose
 (Edit calculation), the calculated column or row is highlighted in the table and the formula is
displayed in the formula bar.
(Edit calculation), the calculated column or row is highlighted in the table and the formula is
displayed in the formula bar.
The story calculations won't be as complex as calculations created using the calculation editor or backend calculations (calculations from the data source that are displayed as Totals in the table when you set the Show Totals option for a dimension in the builder panel).
For example, the following simple table includes numeric and percentage (ratio) data. In this instance, the backend calculation isn't too complex (Profit/Revenue), but the sum calculation created in the table shows a sum of the percentage values, not the expected result.
| A | B | C | D | E | |
|---|---|---|---|---|---|
| Measures | Revenue | Profit | Margin % | ||
| 1 | Product | ||||
| 2 | Apparel | 100.00 | 70.00 | 70.00% | |
| 3 | Footwear | 50.00 | 12.50 | 25.00% | |
| 4 | Accessories | 10.00 | 8.00 | 80.00% | |
| 5 |
Client calculation: =B2+B3+B4 |
Sum |
160.00 | 90.50 | 175.00% |
| 6 |
Backend calculation |
Totals |
160.00 | 90.50 | 56.56% |
Example:
To calculate the difference between a Budget and Actuals version, you can add a calculated column based on the Version dimension:-
Right-click the column header of the Budget version and select
Add column. - To name the new column, select the header, type Variance, and press Enter.
- Select the Variance cell again and type the formula. Use the cell coordinates of the Budget and Actuals column headers, or select each column to create references. For example, =C2-B2. Press Enter.
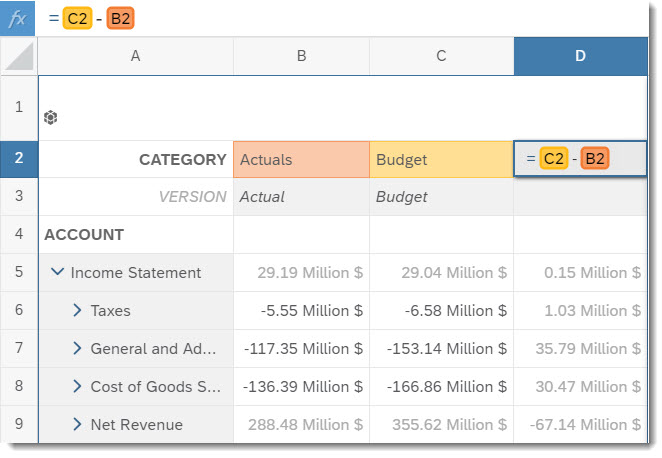
The new column shows the difference between the Budget and Actual version for each account. You can also perform this calculation using restricted measures based on the Cross Calculations dimension.
Create Calculations from Table Rows or Columns
Instead of adding a row or column to the table first and then creating a running calculation formula for the measure, you can select a measure header and pick a formula from the list. These calculations can be added even if you don't have permission to edit the story.
You can also select multiple headers and create a calculation from them.
The numbers that you see in the table are the numbers that are used in the calculations. You can't create complex calculations with these formulas.
How to Create Calculations from Table Rows or Columns
-
In your table, do one of the following:
-
Use a single measure header.
Right-click a measure header, select
Add calculation, select one of the calculations, and then select whether you want a
repeating dimension or a single dimension. -
Repeating: adds a column or row based on each recurrence of the dimension member.
-
Single: adds only one column or row based on the combination of dimension members.
RestrictionRunning functions (for example, Accumulative Sum, Moving Minimum Value, Moving Average, and so on) shouldn't be used for hierarchical data.
RestrictionRunning functions shouldn't be used with SAP BW linked nodes (hierarchy nodes) because the results may not be as expected.
Option Function Moving Minimum Value
runningmin ( <value>) Moving Maximum Value
runningmax ( <value>) Accumulative Sum
runningsum ( <value>) Accumulative Sum of all Detailed Values that are not Zero, Null, or Error
runningsum (<value>, true) Accumulative Sum of Rounded Values
runningsum ( round (<value>)) Accumulative Count of All Detailed Values
runningcount <value> Accumulative Count of all Detailed Values that are not Zero, Null, or Error
runningcount (<value>, true) Moving Average
runningaverage (<value>) Moving Average that is not Zero, Null, or Error
runningaverage ( <value>, true ) Rank Number
rank (<value>) Olympic Rank Number
olympicrank (<value>) Comment
comment (<value>) -
-
Use multiple measure headers.
-
Select two or more measure headers: select one header and then press Ctrl and select one or more measure headers.
-
Right-click and then select
Add calculation, select one of the calculations, and then select whether you want a
repeating dimension or a single dimension.-
Repeating: adds a column or row based on each recurrence of the dimension member.
-
Single: adds only one column or row based on the combination of dimension members.
Calculation options:- Sum
- Subtract
- Multiply
- Divide
- Percentage Difference
- Percentage Share
-
-
-
-
To hide the reference (original) column or row, select the dimension header and then select
 Hide column (or Hide row).
The calculation or comment column or row is still visible. To show the reference column, remove the Hidden filter from the table.
A new row or column containing calculations is added to the table, and the formula is added to the builder panel as Story Calculations for the dimension.
When you select the header for the calculation row or column, the calculation formula is displayed in the formula bar. The
calculation formula will also be displayed when you select (Edit calculation) for the story calculation in the
builder panel.
NULL Handling for Calculated Table Rows or Columns
Null values in most of the calculations in table rows and columns will be handled in the same way that Microsoft Excel handles null values.
When you are creating calculations in your table rows or columns, null values will be ignored, unless they are explicitly included in a calculation. For example, =if(A10 = null,1,2)
Most of the calculations will be handled in the same way that Microsoft Excel handles these calculations. However, finding the average of two null values will be handled differently. Microsoft Excel shows a divide by zero error, but SAP Analytics Cloud shows a null value instead.
The following table shows the results of basic mathematical operations as well as the result of calculating an average.
| Jan | Feb | Jan+Feb | Jan-Feb | Jan*Feb | Jan/Feb | Avg(Jan,Feb) | |
|---|---|---|---|---|---|---|---|
| Tennis shoes |
974,515.73 |
110,881.29 |
1,085,397.02 |
863,634.44 |
108,055,561,267.69 |
8.79 |
542,698.51 |
| Running Shoes |
1,392,121.6 |
15,046.02 |
1,407,167.62 |
1,377,075.58 |
20,945,889,436.03 |
92.52 |
703,583.81 |
| Soccer shoes |
860,000 |
– |
860,000 |
860,000 |
0 |
DIV0_ERR |
860,000 |
| Average sales per month |
1,075,545.78 |
62,963.66 |