Best Practice: Use Filter Line for Filtering Switchable Table and Chart
As an application designer or story developer, learn how to make a filter line apply to both your chart and table, which are switched between each other.
Prerequisites
-
You've already added a table and a chart widget and placed them on top of each other.
-
To follow all functions of this sample use case, you've completed the exercise Best Practice: Switch Between Chart and Table and can now enhance your analytic application or optimized story.
Procedure
- Add a filter line, and place it above the table.
- Change the name of the filter line to FilterLine.
-
In the Builder panel of the filter line:
- Under Source Widget, select the table.
- Under Dimension Selection, choose + Add Dimension, and select Location, Product, Sales Manager and Store from the dropdown list.
-
Write the script to ensure that the filters stay the same after table and chart switch:
-
Hover over the table in Outline, and select

 (Edit Scripts)
  onResultChanged
 .
.
-
Hover over the table in Outline, and select
- Save the application or story, and open it in view time.
Results
When you run the application or story, it looks like this:
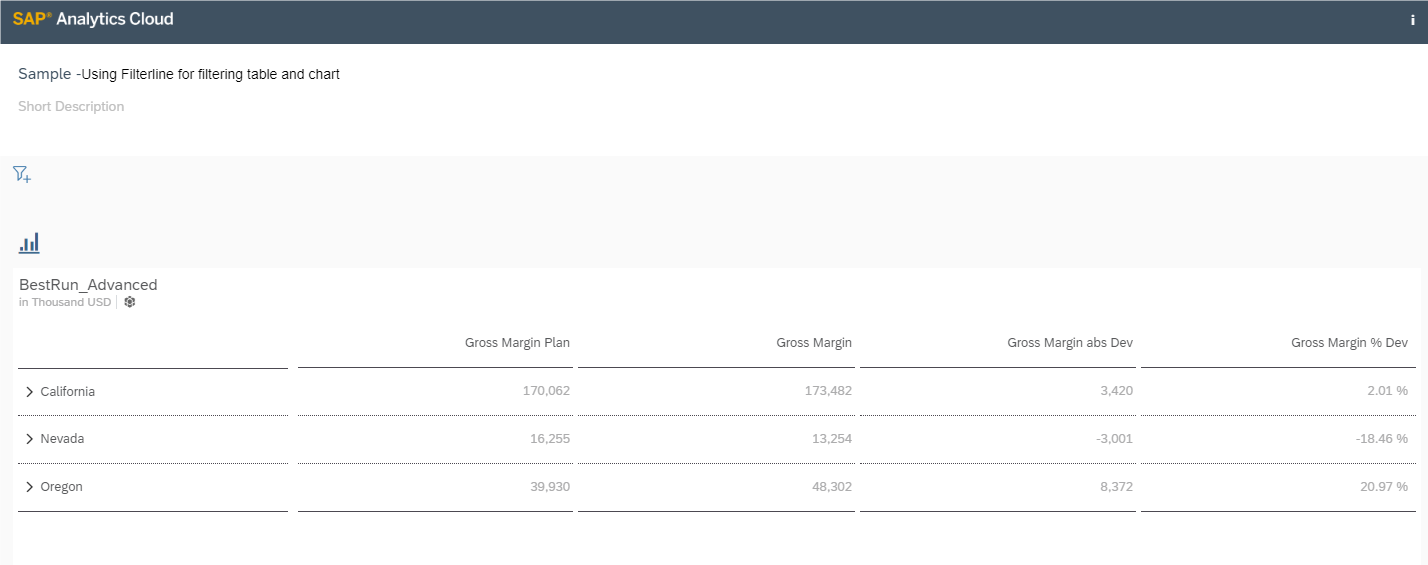
When you select the filter line, the four measures you've configured appear.
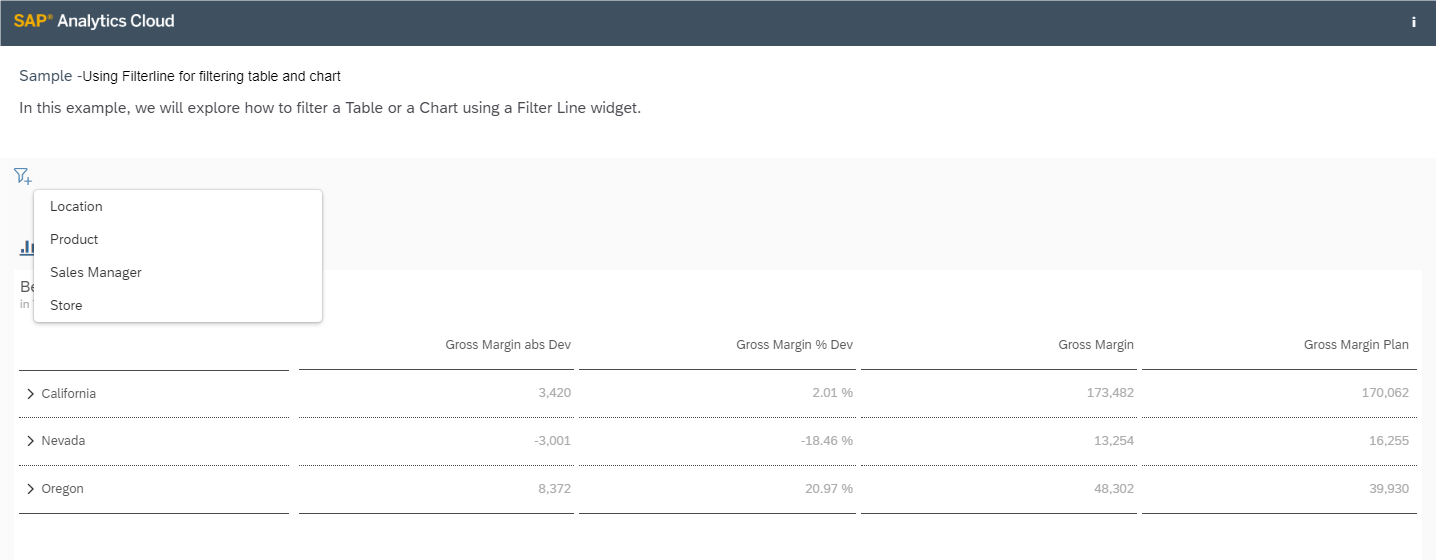
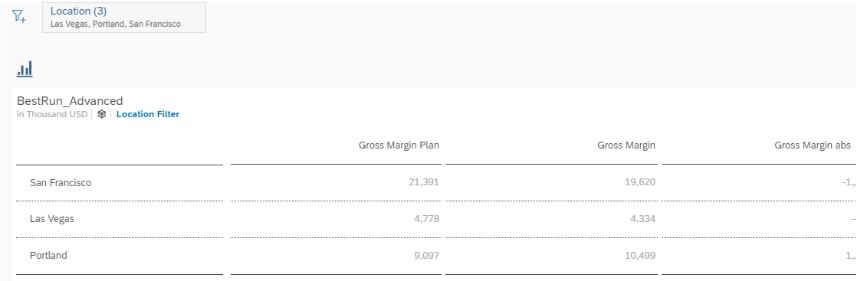
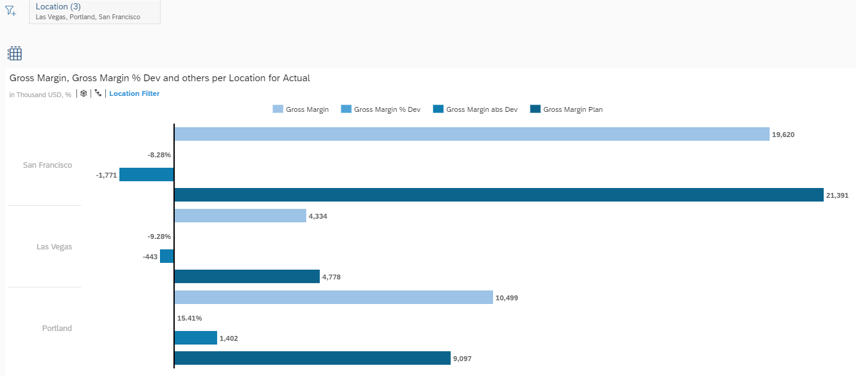
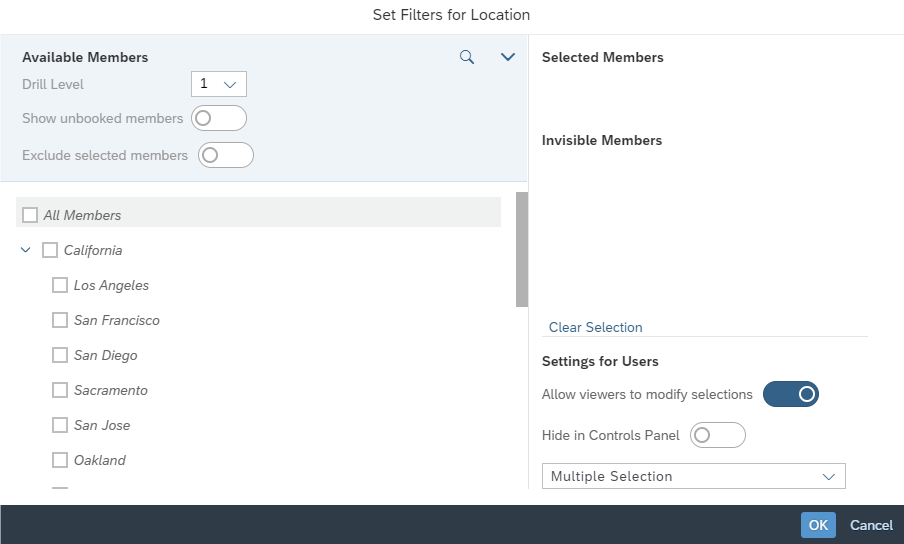
When you select one of the measures, in this example, Location, a window pops up, which lets you choose the members to be included in the table or chart. Let's select San Francisco, Las Vegas and Portland.
The table is updated. The same applies to the chart when you switch to it.