Best Practice: Filter Table and Chart Through Checkboxes (Multi-Selections)
As an application designer or story developer, learn how let viewers to filter on a table or a chart by selecting multiple measures from a checkbox group.
Prerequisites
-
You've already added a table and a chart widget and placed them on top of each other.
-
To follow all functions of this sample use case, you've completed the exercise Best Practice: Switch Between Chart and Table and can now enhance your analytic application or optimized story.
Context
-
Button set selected, which filters on the table and chart according to the selected measures from the checkbox group
-
Button remove all, which removes all the selected measures and saves from deselecting them one by one in the checkbox group
-
Button set all, which applies all the available measures to the table and chart and saves from selecting them one by one in the checkbox group
Procedure
-
In the Builder panel of the checkbox group, select Value 1 and then
 (Delete) to remove it. Remove
Value 2 in the same way.
(Delete) to remove it. Remove
Value 2 in the same way.
-
To define what happens when viewers select a filter value in the checkbox group, create a script object. In this object, write a
function that sets the measure filter according to what viewers have chosen from the checkbox group.
-
To rename the folder, hover over ScriptObject_1, and select

 More
More  Rename
 . Enter Utils.
-
To rename the function, hover over function1, and select More Rename. Enter setMeasureFilter.
-
Select the function setMeasureFilter, and when the Script Function panel
opens, choose
 (Add
Argument) in the Arguments section.
(Add
Argument) in the Arguments section.
-
To write the script for the function setMeasureFilter, hover over it in
Outline, and choose
 (Edit Scripts). Enter the following script in the script editor:
Sample Code
(Edit Scripts). Enter the following script in the script editor:
Sample Code// remove Measures Table.getDataSource().removeDimensionFilter("Account_BestRunJ_sold"); if (CurrentMeasureFilterSelection !== [""]) { for (var i=0;i<CurrentMeasureFilterSelection.length; i++){ Chart.removeMeasure(CurrentMeasureFilterSelection[i], Feed.ValueAxis); } } // add Measures Table.getDataSource().setDimensionFilter("Account_BestRunJ_sold",selectedIds); for (i=0;i<selectedIds.length; i++){ Chart.addMeasure(selectedIds[i], Feed.ValueAxis); } // save the current selection into global variable CurrentMeasureFilterSelection = selectedIds;With this script you define what happens to the table and the chart when viewers select filter values in the checkbox group:
-
The set measures of the table and chart are removed.
-
The values selected in the checkbox group are added as new measures of the table and chart.
-
The currently selected measures are saved in the script variable CurrentMeasureFilterSelection.
-
-
To rename the folder, hover over ScriptObject_1, and select
-
Define what happens when viewers click on the buttons.
-
Hover over the set selected button in Outline, select , and enter the following script in the script
editor:
Sample Code
Utils.setMeasureFilter(CheckboxGroup_Measures.getSelectedKeys());
The script calls the Utils.setMeasureFilter function and passes to it the selected measures of the checkbox group.
-
Hover over the remove all button in Outline, select , and enter the following script in the script
editor:
Sample Code
CheckboxGroup_Measures.setSelectedKeys([""]);
Utils.setMeasureFilter([""]);
The script removes all the selected measures from the checkbox group and passes an empty array to Utils.setMeasureFilter, which updates your table and chart as well as your global variable CurrentMeasureFilterSelection.
-
Hover over the set all button in Outline, select , and enter the following script in the script
editor:
Sample Code
CheckboxGroup_Measures.setSelectedKeys(AllMeasures);
Utils.setMeasureFilter(AllMeasures);
The script sets the selected keys of the checkbox group to the AllMeasures script variable you defined before and passes the same variable to the Utils.setMeasureFilter function.
-
Hover over the set selected button in Outline, select
-
Define what happens when the application or story is first run.
-
In Outline hover over Canvas (for analytic applications) or the relevant
page (for optimized stories), select (Edit Scripts) onInitialization.
-
In Outline hover over Canvas (for analytic applications) or the relevant
page (for optimized stories), select
Results
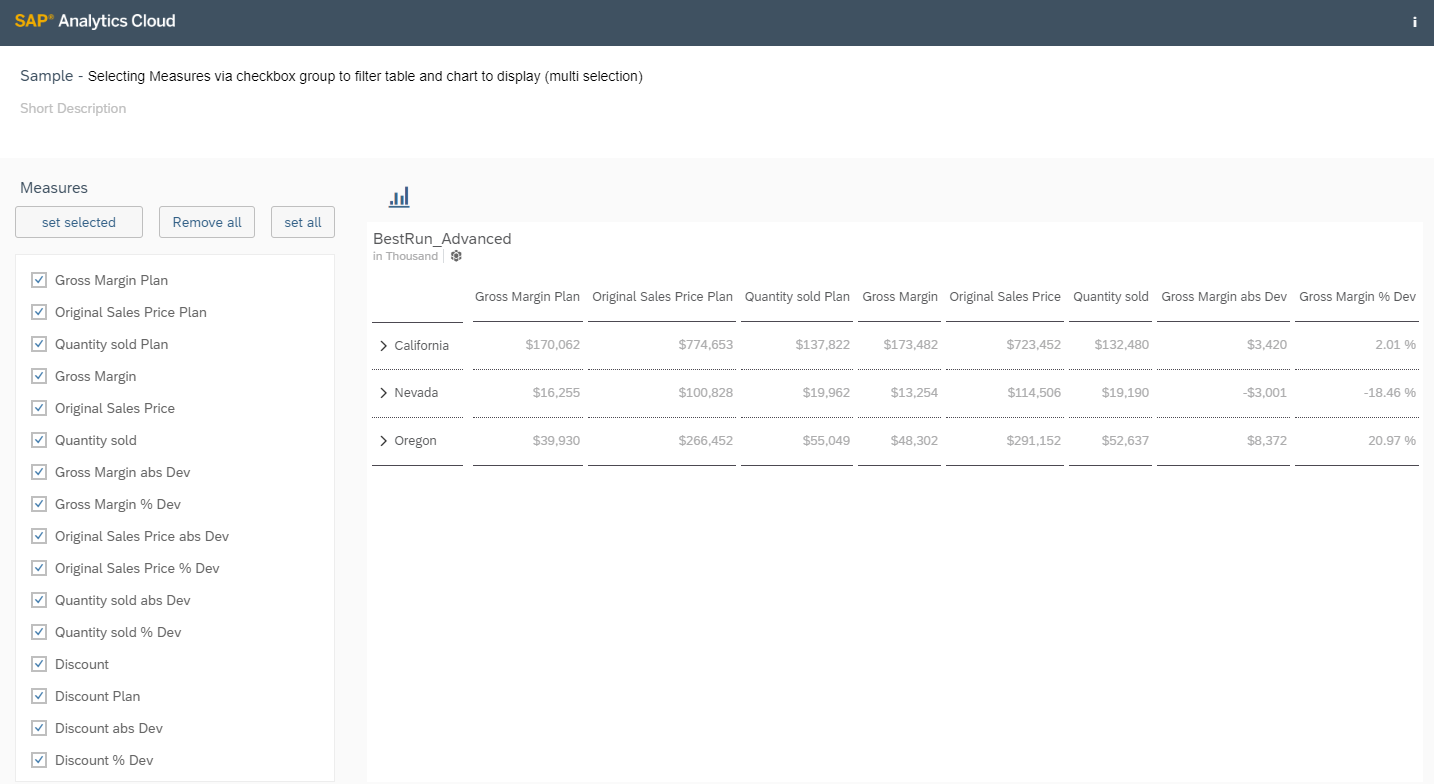
When you run the application or story, it looks like this:
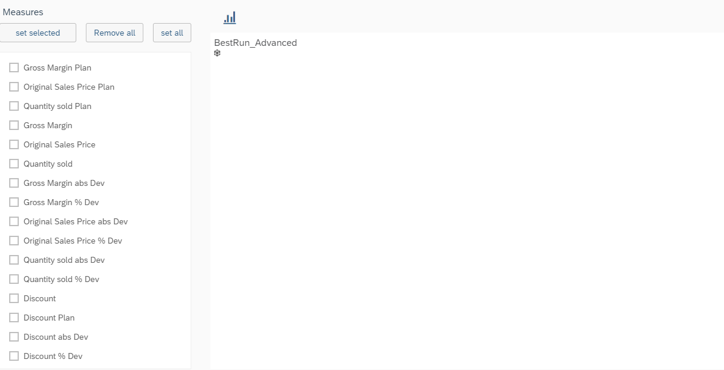
If you click on the remove all button, all measures are deselected, and there's no data on the table.
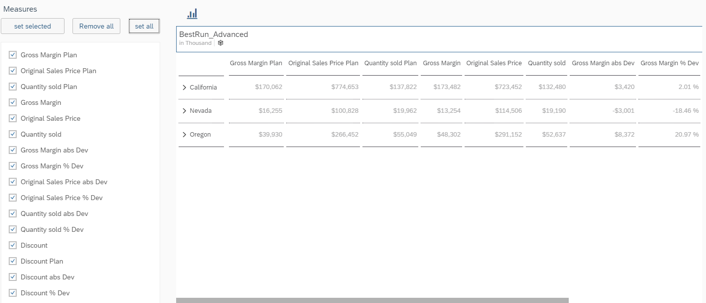
If you click on the set all button, all measures are selected and the table looks the same as when you first ran the application or story.
Let's select a few measures, Gross Margin Plan, Quantity Sold, Original Sales Price abs Dev, and Discount, in the checkbox group and click on the set selected button. The table is updated accordingly.
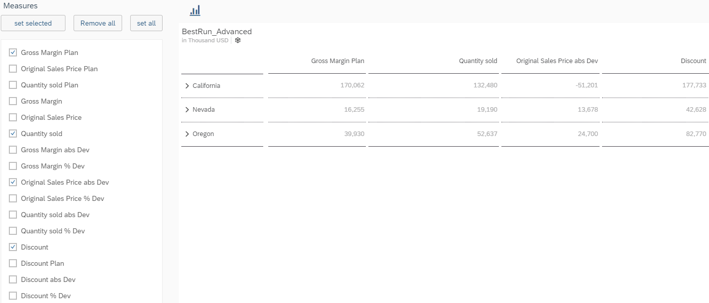
The same
applies to the chart after you click on  .
.