Time Series Charts (Specifics for SAP BW)
You can create time series charts with level-based hierarchies that use data from SAP BW live data sources, but there are some restrictions.
Specific Considerations for Query Models
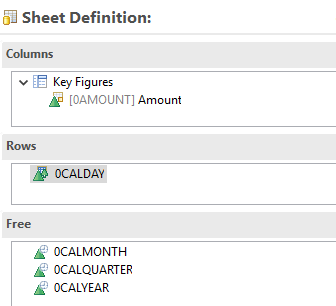
In order to switch between different time granularity levels in SAP Analytics Cloud, all dimensions (characteristics) that are members of the level-based hierarchy should be among the free characteristics.
The following screenshot shows the default hierarchy based on Calendar day. The hierarchy levels are Year, Quarter, Month, and Day.
Quarter is also modeled in the free characteristic area so that you can switch between different hierarchies.
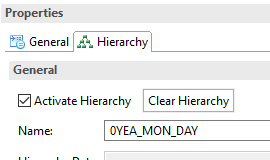
One of the valid hierarchies should be present as a default hierarchy for the date dimension. Otherwise, the time series chart won't be rendered until the hierarchy is manually changed.
The following screenshot shows that the hierarchy (with levels Year, Month, and Day) is active in the query definition when you run the query in SAP Analytics Cloud.
If you want to make the levels of the hierarchy available, you need to activate the virtual time hierarchies within SAP BW. For more information, see Activating Virtual Time Hierarchies.
Restrictions
- Restricted measure on a level-based date dimension with any of the following scenarios:
-
The value is not displayed if you select date calculations (for example, previous year).
-
The chart stops rendering if you select by range.
You can display the range by selecting members using an input control and then filtering by range.
-
- Non-concatenated date dimensions are currently not selectable inside time series charts. (For example, 0CALMONTH2, 0CALQUART1, and 0HALFYEAR1)
- Fiscal date dimensions are currently not selectable inside time series charts. (For example, 0FISCYEAR and 0FISCPER)