The Lift Curve
Use the lift curve to see how much better your predictive model is than the random predictive model.
The lift is a measure or the effectiveness calculated as the ratio between the results obtained with and without a predictive model. The lift curve evaluates predictive model performance in a portion of the population.
How to read the lift curve?
The X axis shows the percentage of the population and is ordered from highest probability to lowest probability.
The Y axis shows how much better your model is than the random predictive model.
Example of a Lift Curve
Example
A company wants to do a mailing campaign. They have built a predictive model to
target to which customers to send the campaign. The predictive model will
classify the customers into two categories:
The predictive model debrief displays the following Lift
Curve: - Positive Targets: the customers will response to the campaign.
- Negative Targets: the customers will not response to the campaign.
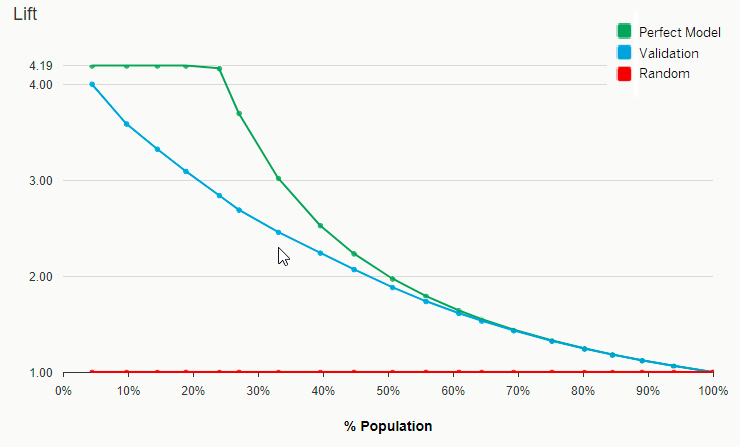
You can see that
by selecting 20% of the total population:
- You would reach 3.09 times more positive cases with your predictive model than with a random predictive model.
- A perfect predictive model would reach 4.19 times more positive cases than the random predictive model.