Best Practices for Performance Optimization in Your Analytic Application Design
Follow the tips to help your analytic applications run smoothly with optimized performance.
Top Tips
To significantly improve the analytic application performance at startup and save system resources, first consider the following four tips.
Load Invisible Widgets in Background
Loading and displaying visible widgets first before invisible ones makes the startup screen appear faster and thus increases your
analytic application’s performance. To do this, from the toolbar select 
 (Edit Analytic
Application)
(Edit Analytic
Application) 
 Analytic Application Settings and then Load invisible widgets in the
background in the dialog.
Analytic Application Settings and then Load invisible widgets in the
background in the dialog.
Invisible widgets aren’t only widgets set to be hidden in runtime but also those inside invisible containers or on inactive tabs in tab strips, pages in page books and popups.
For more detailed information, see Use Background Loading for Widgets in Your Analytic Applications.
Pause Data Refresh in Widgets
You can pause the refresh of specific widgets in your analytic application. For example, you can use setRefreshPaused API to pause the initial refresh of a chart or table until it’s updated by setDimensionFilter API in the onInitialization event. You can select Refresh Active Widgets Only from the Builder panel to pause the refresh of invisible widgets except when they are called by fetch data APIs.
For more detailed information, see Use Pause Refresh Options and APIs.
Enable Planning on Tables Only When Planning Is Used
You can deselect Planning Enabled from the Builder panel of a table using planning model if it isn’t used for planning at all. You can also leverage getPlanning().setEnabled API to enable planning at runtime whenever it’s needed.
For more detailed information, see Use Planning Enabled Property and setEnabled API.
Use MemberInfo Object with setDimensionFilter() API
Use a MemberInfo object in setDimensionFilter() API, which contains member description in addition to member ID, so that there’s no roundtrip to the backend to fetch the member’s description.
For more detailed information, see Use MemberInfo Object in setDimensionFilter() API.
Design Tips
You can improve your analytic application's performance by design. You'll also receive related system reminders when building your application.
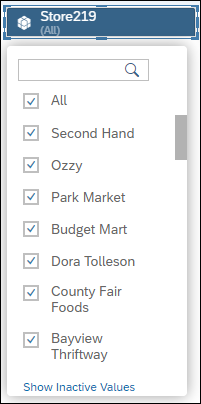
Collapse Input Controls
Expanded input controls are convenient because they allow you to quickly search for or select members. However, an expanded input control refreshes often and may affect the application's performance.
When you have an input control with high cardinality dimension, for example, with 100 dimension members or more, leaving it expanded can affect your application's performance.
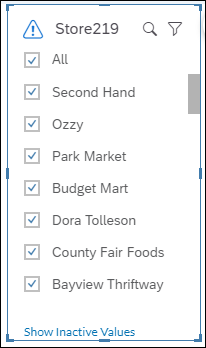
Input controls with hierarchical dimension can also affect the application's performance when expanded, even if they have fewer members.
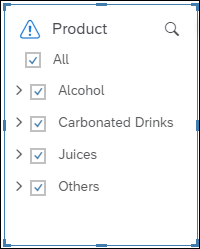
Therefore, we recommend collapsing input controls. When an input control is collapsed, you must select it to display all the members.
Manually Set Top N
If you have high cardinality dimension, consider manually setting the top N values rather than using auto top N.
When auto top N is used, all the data are transferred from the system, which takes a while to render the top N values. However, when you set top N, the data are sorted and top N values are selected in the system first. Only top N values are sent, which are immediately rendered.
Keep Images Small
Whenever possible, upload background images that are 1 MB or smaller. Larger images take longer to load and will have an impact on your application's performance.
To get a good quality background image, you could use a compressed web image or an SVG image.