Best Practice: Handle Selections in Table and Chart and Open a Details Popup
As an application designer or story developer, learn how to create a popup window for viewers that contains extra information about the selected elements.
Prerequisites
-
You've already added a table and a chart widget and placed them on top of each other.
-
To follow all functions of this sample use case, you've completed the exercise Best Practice: Switch Between Chart and Table and can now enhance your analytic application or optimized story.
Context
Viewers can open a popup window, which displays information about their selections.
In the table, they can select a measure cell, a dimension cell or a data cell. In the chart, they can select a dimension cell and a measure or dimension chart bar, for example, Gross Margin Plan for Lemonade.
-
The first lets them choose which dimension (Location, Product, Store or Sales Manager) to be filtered on the table or chart.
-
The second displays the available hierarchies that can be used to change how the data is displayed.
In this example, only single selection is supported for the table and chart.
Procedure
-
Add the values to be selected from the dropdowns.
-
In the Builder panel of Dropdown_Dimensions, under Dropdown
Value choose
 (Add).
- For Value 1, enter Location_4nm2e04531 as ID and Location as dedicated text.
- Add a second value, with Product_3e315003an as ID and Product as dedicated text.
- Add a third value, with Store_3z2g5g06m4 as ID and Store as dedicated text.
- Add a fourth value, with Sales_Manager__5w3m5d06b5 as ID and Sales Manager as dedicated text.
- Set Location as default value.
-
In the Builder panel of Dropdown_Dimensions, under Dropdown
Value choose
-
Create a popup.
-
In the Outline panel, (for analytic application) choose next to Popups, or (for
optimized stories) hover over the relevant page, and select


 Add Popup
 .
.
- In the Styling panel of the popup, change the ID to Popup_Details. Under Popup Size, set its width to 800 and height to 400.
- In the Builder panel of the popup, switch on Enable header & footer.
- Enter Details as title .
- Add a Cancel button. Enter BTN_Cancel as ID and Cancel as dedicated text. Then, check all three options Emphasized, Enabled and Visible.
- Choose Apply to save the changes.
-
In the Outline panel, (for analytic application) choose
-
Hover over Dropdown_Dimensions in the Outline panel, choose
 (Edit Scripts), and enter the
following script in the script editor:
Sample Code
(Edit Scripts), and enter the
following script in the script editor:
Sample CodeTable.addDimensionToRows(sel); //Chart Chart.removeDimension(CurrentDimension,Feed.CategoryAxis); Chart.addDimension(sel, Feed.CategoryAxis); //Details_Chart remove dimension filter Details_Chart.getDataSource().removeDimensionFilter(CurrentDimension); // write filter information into the browser console console.log(['CurrentDimension: ',CurrentDimension]); console.log(['Selection: ', sel]); // save the current selection (dimension) into a global variable CurrentDimension = sel; // get hierarchies from the current dimension var hierarchies = Table.getDataSource().getHierarchies(CurrentDimension); var flag = true; // remove all current items form the Dropdown_Hierarchies Dropdown_Hierarchies.removeAllItems(); // loop for (var i = 0; i < hierarchies.length; i++) { if (hierarchies[i].id === '__FLAT__') { Dropdown_Hierarchies.addItem(hierarchies[i].id,'Flat Presentation'); } else { Dropdown_Hierarchies.addItem(hierarchies[i].id,hierarchies[i].description); if (flag === true) { var hierarchy = hierarchies[i].id; flag = false; } } } // write hierarchy information to browser console console.log(['Hierarchy: ', hierarchy]); console.log(['Current Dimension: ',CurrentDimension]); // set Flat Hierarchy as Default Dropdown_Hierarchies.setSelectedKey('__FLAT__'); // Table Table.getDataSource().setHierarchy(CurrentDimension,'__FLAT__'); // Chart Chart.getDataSource().setHierarchy(CurrentDimension,'__FLAT__'); // Details_Chart Details_Chart.getDataSource().setHierarchy(CurrentDimension, '__FLAT__');This onSelect function first gets the selected element of the list. It then replaces any already set dimensions in table and chart by the newly selected dimension. This dimension is also added to the details chart in your popup window. It writes the filter information in the browser console and saves the selection in the script variable CurrentDimension.
To set the available hierarchies for the selected dimension, the script loops through the available hierarchies of the data source in relation to the current dimension to push all available hierarchies in the dropdown list.
Finally, the default hierarchy for table, chart and details chart is set to flat presentation.
-
Hover over
Dropdown_Hierarchies in the Outline panel, click (Edit Scripts), and enter the following script in the
script editor:
Sample Code
var sel = Dropdown_Hierarchies.getSelectedKey();

// set hierarchy for Table
Table.getDataSource().setHierarchy(CurrentDimension,sel);

// set hierarchy for Chart
Chart.getDataSource().setHierarchy(CurrentDimension,sel);

// set hierarchy for Details Chart
Details_Chart.getDataSource().setHierarchy(CurrentDimension, sel);
This onSelect function simply sets the hierarchy of table, chart and details chart to the selected element in the dropdown list.
-
In the Outline panel, hover over Table, choose (Edit Scripts), and enter the following script in the
script editor:
Sample Code
var sel = Table.getSelections();
console.log(['Table Selection: ', sel]);
Details_Chart.getDataSource().removeDimensionFilter(CurrentDimension);
var Popup_show = false;
if (sel.length > 0) {
	var selection = sel[0];
	for (var dimensionId in selection) {
 		var memberId = selection[dimensionId];
 		if (dimensionId === '@MeasureDimension') {
			// Measure
 			console.log(['Selection Measure: ',dimensionId]);
 			console.log(['Selection Member: ', memberId]);
			 // remove current measure
			 console.log(['CurrentMeasures: ',CurrentMeasures]);
			 for (var i = 0; i < CurrentMeasures.length;i++) {
				Details_Chart.removeMeasure(CurrentMeasures[i],Feed.ValueAxis);
				Details_Chart.addMeasure(memberId,Feed.ValueAxis);
		 }
//		Details_Chart.addMeasure(memberId,Feed.ValueAxis);
 		CurrentDetailsMeasures.push(memberId);
 		Popup_show = true;
 	}
 	// Dimension
	else {
 		console.log(['Selection Dimension: ',dimensionId]);
 		console.log(['Selection Member: ', memberId]);
		Details_Chart.getDataSource().setDimensionFilter(dimensionId, memberId);
 		Popup_show = true;
	 }
	 }
}
if (Popup_show === true) {
 Popup_Details.open();
}
This onSelect function captures the selection made in the table and writes it into the console.
Until the selected element is determined, the popup window is set invisible. The script loops over the table, captures whether it was a measures, dimension or data cell and then pushes this information unto the Details chart. Then the selected measures are saved in the variable CurrentDetailsMeasures.
Finally, the popup is set to visible and the popup window opens.
-
In the Outline panel, hover over Chart, choose (Edit Scripts), and enter the following script in the
script editor:
Sample Code
var sel = Chart.getSelections();
console.log(['Chart Selection: ', sel,CurrentMeasures]);
var Popup_show = false;

if (sel.length > 0) {

	Details_Chart.getDataSource().removeDimensionFilter(CurrentDimension);

 	// remove the current measures
 	for (var i = 0; i < CurrentMeasures.length; i++) {
 	Details_Chart.removeMeasure(CurrentMeasures[i],Feed.ValueAxis);
 	}

	for (i = 0; i < sel.length; i++) {
		var selection = sel[i];

			for (var dimensionId in selection) {
 				var memberId = selection[dimensionId];

			if (dimensionId === '@MeasureDimension') {
 				// Measure
 				console.log(['Add Selection Measure: ',dimensionId]);
 				console.log(['Add Selection Member: ',memberId]);

				Details_Chart.addMeasure(memberId,Feed.ValueAxis);
 				CurrentDetailsMeasures.push(memberId);
 				Popup_show = true;

	 		}
 			// Dimension
 			else {
 				console.log(['Selection Dimension: ',dimensionId]);
 				console.log(['Selection Member: ',memberId]);

				Details_Chart.getDataSource().setDimensionFilter(dimensionId, memberId);
 				Popup_show = true;
 			}
 		}
 	}
}

if (Popup_show === true) {
 	Popup_Details.open();
}
This onSelect function gets the selected element of the chart and saves it in the variable sel.
The popup window is set to invisible. The script removes the current measures from Details_Chart and replaces with the measure or dimension filter. Then, the selected measures are saved in the variable CurrentDetailsMeasures.
Finally, the popup is set to visible and the popup window opens.
-
To write the script for the button Cancel, hover over Popup_Details in the
Outline panel, select
(Edit Scripts), and enter the following script in the script editor:
Sample Code
// remove the current measure selection and set all default measures for the details chart
for (var i = 0; i < CurrentDetailsMeasures.length; i++) {
	Details_Chart.removeMeasure(CurrentDetailsMeasures[i], Feed.ValueAxis);
}
CurrentDetailsMeasures = ArrayUtils.create(Type.string);
for (i = 0; i < CurrentMeasures.length; i++) {
	Details_Chart.addMeasure(CurrentMeasures[i], Feed.ValueAxis);
}

// close the popup
Popup_Details.close();
This opens the OnButtonClick script of the popup.
This script removes the content of the variable CurrentDetailsMeasures from Details_Chart and sets the default measures from the script variable CurrentMeasures as the measure of the details chart.
Lastly, the popup window closes when viewers click on the button.
-
Define what happens when the application or story is first run by creating the onInitialization function.
-
In the Outline panel, hover over Canvas (for analytic applications) or the
relevant page (for optimized stories), and select (Edit Scripts) onInitialization.
-
In the Outline panel, hover over Canvas (for analytic applications) or the
relevant page (for optimized stories), and select
Results
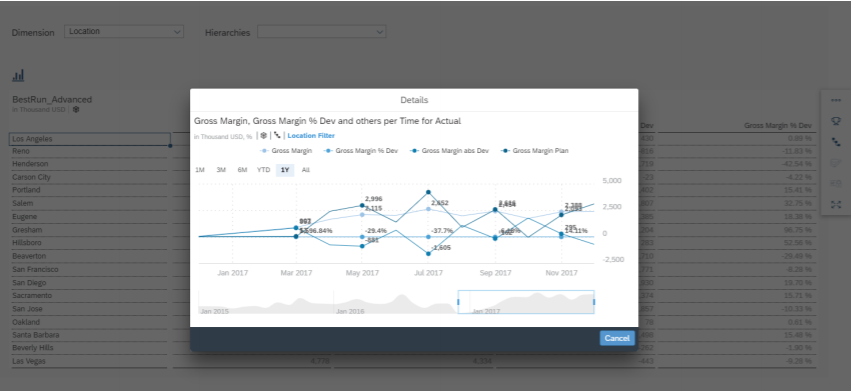
When you run the application or story, it looks like this:
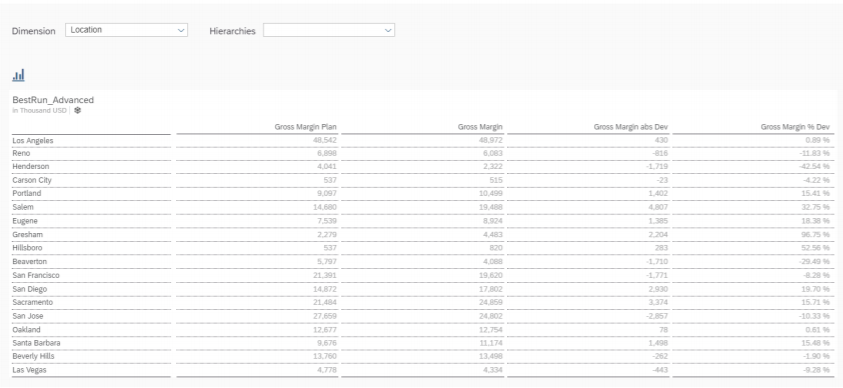
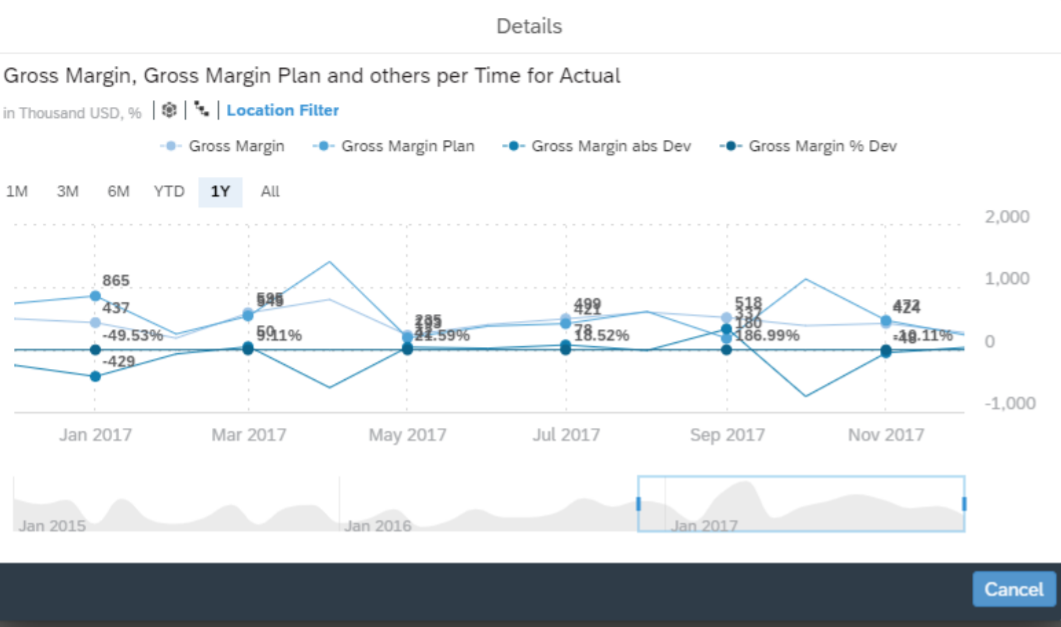
If you select dimension data cell Los Angeles, the popup window appears. It gives an overview of the measures Gross Margin, Plan, Absolute and Percent for the location Los Angeles over time.
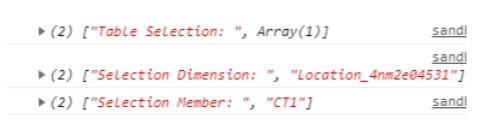
In the browser console, you can always see the current selection printed here.
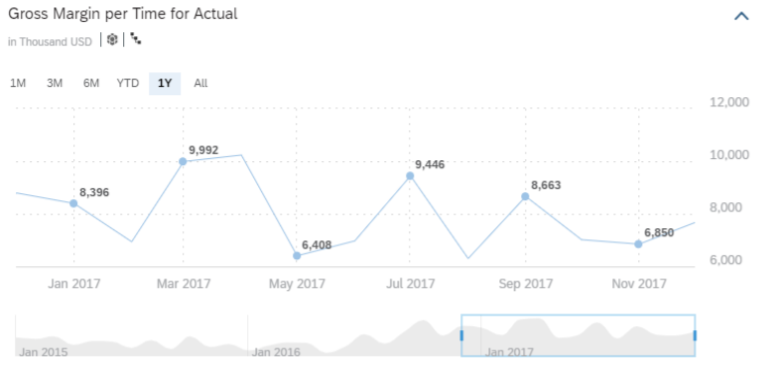
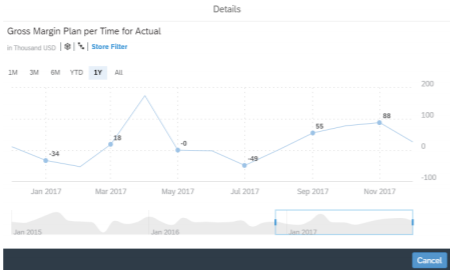
If you select the measure cell Gross Margin Actual, this measure is shown in the popup window in relation to time.
You can also select an individual data cell. If you change the dimension to Store and select the data cell at the crossover of Gross Margin Plan and Country Fair Foods, the popup shows plan gross margin in relation with time and with a store filter of Country Fair Foods.
If you change the dimension to Location, the hierarchy to States and choose Nevada, the popup window appears.
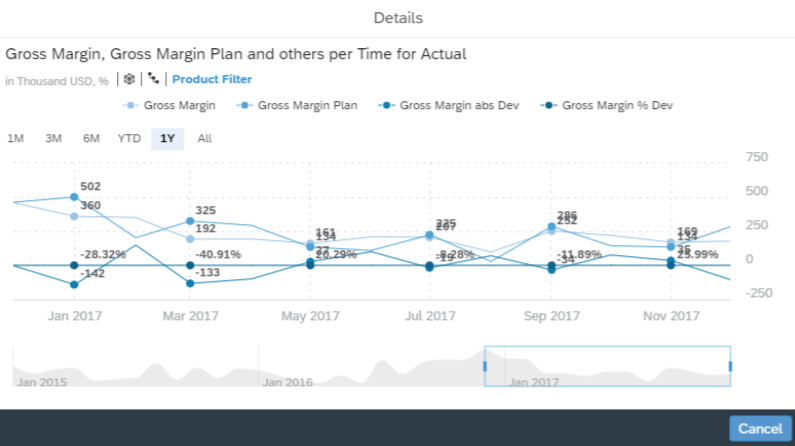
If you switch to the chart, select Product as dimension and choose Lemonade, the popup shows all the measures over time for this product.
Select the measure Gross Margin Abs Dev in regard to the dimension Orange with pulp.
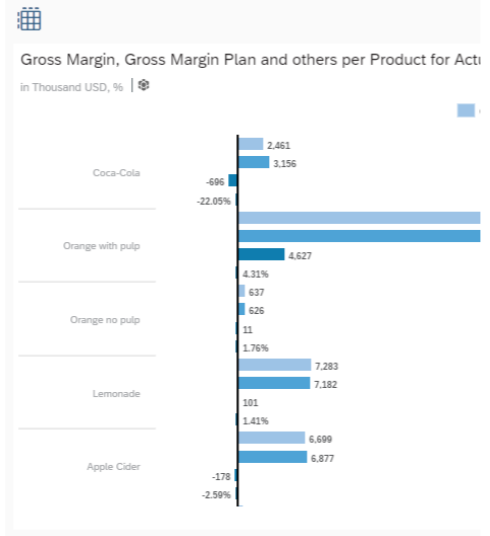
The popup then looks like this.
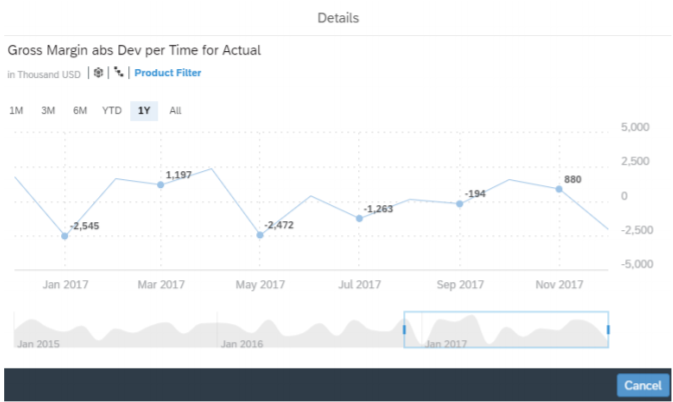
You can always check the filters.