Plan with Currency Conversion
For models with different currencies in SAP Analytics Cloud, you have the flexibility to plan on any available currency. However, most planning operations don’t apply currency conversion when copying data across currencies or disaggregating it to multiple currencies, so messages will let you know when this happens.
Planning with Currency Conversion in a Different Model Types
Models with Measures
-
You don’t have to pick a single planning currency when you start planning on a version. You can enter data on base measures or currency conversion measures and immediately see the updated values for the other dependent measures.
-
You can copy data across different currencies using a currency conversion step in a data action. See Convert Currencies in a Data Action for details.
-
Models no longer limit the number of conversions that you can analyze and plan on in a story or analytic application.
Classic Account Models
With the classic account model, you choose whether to plan on the base currency values or a currency conversion when you start planning on a version. When you create a private version, you select how you want to plan in the dialog. When you start editing a public version, the currency is set by the first cell you edit and the cross calculation of that cell.
If you plan on the base currency values, you won't be able to enter values outside the cross calculations showing the base currencies.
If you plan on a currency conversion, all values stored in the version must also be converted to that currency, even values that are not currently visible, and corresponding rates must be maintained. Other cross calculations won't show values until you publish the version.
See Create, Publish, and Manage Versions of Planning Data for more information about copying and publishing versions.
Planning Across Currencies
-
If you copy a value of 500 USD to a cell that displays a value in Euros, the resulting value is 500 Euros.
-
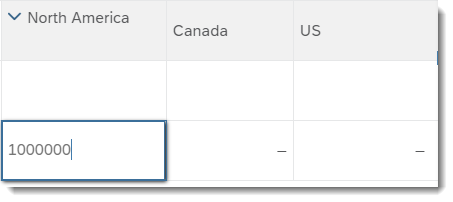
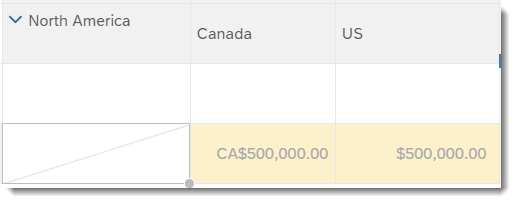
If you enter 1 million to an unbooked account for North America while planning in local currencies, it could result in values of 500,000 CAD for Canada and 500,000 USD for the United States. The numerical value is divided evenly, but not the monetary value.
 Data entry on North America
 Automatic spreading to Canadian and US dollars
In cases such as this one, a message appears to let you know that data has been entered in multiple different currencies. To avoid this, you can plan on a single fixed currency instead, and the values will be properly disaggregated and then converted to the local currencies.
In a model with measures, you can also use conversion steps to copy and convert data in multiple currencies to a base measure with a fixed currency, which can then be used for planning.
-
Setting the currency dimension as a target in an allocation step.
-
Using the currency dimension in a copy rule or as the Aggregate To dimension.
-
Copying data across measures with different currencies, without using a conversion step.
Example: Applying a Rate Version to a Forecast
Your organization uses a currency-enabled planning model to perform planning tasks, including forecasting.
Each quarter, you and your colleagues are responsible for creating a new forecast for the year by copying the forecast from the previous quarter, updating the figures based on changing assumptions, and publishing the forecast as a new public version. Currently, you have a forecast for the year created in Q1 with the following data, displayed in a fixed USD currency conversion:
|
A |
B |
C |
D |
|
|---|---|---|---|---|
|
1 |
CATEGORY |
Forecast |
||
|
2 |
VERSION |
ForecastQ1 |
||
|
3 |
ACCOUNT | ORGANIZATION | ||
|
4 |
Expenses |
|
$3 820 000 |
|
|
5 |
EU |
$3 300 000 |
||
|
6 |
North America |
$520 000 |
So far, no changes are required for the ForecastQ2 values. However, predictions about the value of the US dollar have shifted, so you need to adjust the conversion rates applied to ForecastQ2. Because you want to be able to compare the scenarios presented in each forecast, including different exchange rate assumptions, you don’t want to simply change the rates that apply to all forecasts for the year.
To do this, you can create a new rate version to apply to ForecastQ2. The ForecastQ1 version uses the default rates for the Forecast category. You can copy these rates to a new rate version for ForecastQ2 and then update the rates for Q3 and Q4.
- You select and choose the currency table for the model.
- You select
 next to the
Category column header in the currency table, and select Forecast from the
Filter section to show only the Forecast rates. Note that there is no Rate Version, because these
are generic rates for the Forecast category.
next to the
Category column header in the currency table, and select Forecast from the
Filter section to show only the Forecast rates. Note that there is no Rate Version, because these
are generic rates for the Forecast category.A
B
C
D
E
F
Source Currency
Valid From
Target Currency
Category
Rate Version
Rate
1
USD
2017.01.01
EUR
Forecast
0.95
2
EUR
2017.01.01
USD
Forecast
1.05
3
USD
2017.03.01
EUR
Forecast
0.95
4
EUR
2017.03.01
USD
Forecast
1.05
5
USD
2017.06.01
EUR
Forecast
1
6
EUR
2017.06.01
USD
Forecast
1
7
USD
2017.09.01
EUR
Forecast
0.9
8
EUR
2017.09.01
USD
Forecast
1.11
- To quickly create a new rate version, you copy and paste all of these cells below the existing data. To specify a rate
version, set the Category to Specific for the first of the new cells and then
select the bottom right corner of the cell and drag it to the other rate version cells to copy the value. Next, add a name in
the Rate Version column, such as Q2Rate. You can then update the exchange rates for the new rate
version by typing values in the Rate column, and then save the Currency table.
A
B
C
D
E
F
Source Currency
Valid From
Target Currency
Category
Rate Version
Rate
1
USD
2017.01.01
EUR
Forecast
0.95
2
EUR
2017.01.01
USD
Forecast
1.05
3
USD
2017.03.01
EUR
Forecast
0.95
4
EUR
2017.03.01
USD
Forecast
1.05
5
USD
2017.06.01
EUR
Forecast
1
6
EUR
2017.06.01
USD
Forecast
1
7
USD
2017.09.01
EUR
Forecast
0.9
8
EUR
2017.09.01
USD
Forecast
1.11
9
USD
2017.01.01
EUR
Specific
Q2Rate
0.95
10
EUR
2017.01.01
USD
Specific
Q2Rate
1.05
11
USD
2017.03.01
EUR
Specific
Q2Rate
0.95
12
EUR
2017.03.01
USD
Specific
Q2Rate
1.05
13
USD
2017.06.01
EUR
Specific
Q2Rate
0.9
14
EUR
2017.06.01
USD
Specific
Q2Rate
1.11
15
USD
2017.09.01
EUR
Specific
Q2Rate
0.8
16
EUR
2017.09.01
USD
Specific
Q2Rate
1.25
You can now return to editing the story to create a new forecast version that uses the Q2Rate exchange rates. For a model with measures, you can just copy the version and select the Q2Rate from the Rate Version list.
For a classic account model, the table needs to display local currencies (that is, the unconverted base currency data in your model). To do this, you add the Cross Calculations dimension to the table by selecting Add Measures/Dimensions under the Columns heading of the Builder pane, and choosing Cross Calculations. You then select (Manage Filters) next to the Cross Calculations
dimension and choose Local Currency as well as Default Currency (USD), and
select OK.
(Manage Filters) next to the Cross Calculations
dimension and choose Local Currency as well as Default Currency (USD), and
select OK.- From the Tools menu, you select
 (Version Management) and choose
  (Copy) next to ForecastQ1.
You name the version ForecastQ2 and choose Q2Rate in the Rate Version list. (For a classic account
model, you need to select Local Currency in the Change conversion list first).
You can use the same process to continue adding new forecast versions and adjusting exchange rates as necessary. You can also apply rate versions to versions in different categories, or create currency conversions using the Calculation Editor to apply specific rate versions.
 World
World


