Prediction Explanations
The Prediction Explanations can be used to display the reasons explaining why Smart Predict has generated a specific prediction for a specific entity of the application dataset.
-
For classification, a positive strength pushes the prediction (score or probability) towards the positive value of the target, while a negative value pushes the prediction towards the negative value of the target.
-
For regression, a positive strength increases the predicted value, while a negative strength decreases the predicted value.
Each explanation corresponds to a row of the output dataset associated to the following columns:
| Column | Description |
|---|---|
|
Explanation Rank (classification and regression) |
For each prediction, the explanations are ranked according to their impact (absolute strength value) on the prediction. The lower the rank, the most important the impact of the specific explanation on the prediction. |
|
Explanation Influencer (classification and regression) |
This column provides the name of the influencer for the explanation. |
|
Explanation Influencer Value (classification and regression) |
This column provides the value associated to the influencer for this prediction. This column can mix different types of values depending on the associated influencer (number, string, date…). Therefore, the type of this column is always string and no local relevant formatting is applied to the value (default English local is used always). |
|
Explanation Strength (classification and regression) |
This column is a normalized representation of the contribution (impact) of the influencer for the prediction. |
|
Explanation Contribution (regression only) |
This column is the contribution of the influencer for the prediction. The contribution has same scale as the target. If you are predicting an amount in US dollar and the contribution is “10” then the contribution can be interpreted as “10 US dollars”. |
Restrictions
-
Smart Predict includes both other positive reasons and other negative reasons. Hence, it can generate less than 10 explanations in certain scenarios..
-
When the Prediction Explanations option is used, the size of the input dataset is limited to 100 columns and 90,909 rows. This comes from the 1 million rows restriction for the dataset. As 11 rows are generated for each entity when the explanations are enabled, an input of 90 909 rows will lead to 90 909 * 11 = 1 million row in the output.
Positive Others and Negative Others (Pseudo Influencers)
-
Positive Others: aggregates the smallest positive influencers
-
Negative Others: aggregates the smallest negative influencers
The strength associated to Positive Others and Negative Others is the sum of the strength of the aggregated explanations.
When the predictive model uses less than 10 or exactly 10 influencers to generate the predictions, Others group is not generated as the provided list of explanations is complete.
Baseline Pseudo Influencer
To allow the explanation for regression predictive models to be visualized using waterfall charts, Smart Predict introduces a Baseline pseudo influencer. The contribution for the baseline influencer is the mean of the predicted target and represents the average prediction. The predicted value is the sum of this baseline contribution with the contributions of the other influencers used by the predictive model. In other words, the predictions are centered on this baseline contribution.
Example
Let us assume we have generated some attrition predictions for a set of employees enabling the Prediction Probablity and Prediction Explanations.
The table below shows the rows that have been generated for the employee GOV92027.
| Employee_ID | Prediction Probability | Explanation Rank | Explanation Influencer | Explanation Influencer Value | Explanation Strength |
|---|---|---|---|---|---|
| ... | ... | ... | ... | ... | ... |
| GOV92027 | 0, 64 | 0 | |||
| GOV92027 | 1 | Age | 67 | 6,83 | |
| GOV92027 | 2 | Salary | 86000 | -1,60 | |
| GOV92027 | 3 | Prev_Performance_Rating | Failed to Meet Expectations | 0,88 | |
| GOV92027 | 4 | Gender | Male | -0,62 | |
| GOV92027 | 5 | Critical_Job_Role | Yes | 0,48 | |
| GOV92027 | 6 | Organization_Tenure_Months | 48 | 0,43 | |
| GOV92027 | 7 | Employment_Type | Full-Time | 0,04 | |
| GOV92027 | 8 | Ethnic_Background | Caucasian | 0,11 | |
| GOV92027 | 9 | Positive Others | Positive Others | 0,06 | |
| GOV92027 | 10 | Location | North America | 0,05 | |
| ... | ... | ... | ... | ... | ... |
-
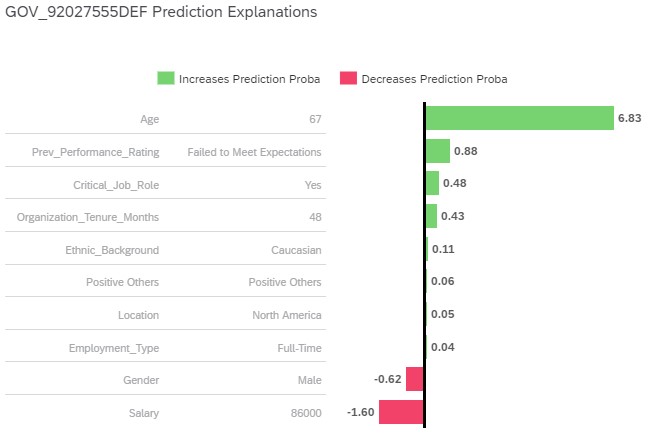
The influencer that had the greatest impact on the predicted probability to leave the company for the employee GOV92027 specifically is Age. Age=67 has a very strong positive influence on the likelihood to leave (it strongly increases the chances for this employee to leave).
-
The second strongest influencer that impacted the predicted probability to leave the company for GOV92027 is Salary. Salary=86000 has a meaningful negative impact on the likelihood to leave the company (because the strength is negative, it decreases the chances for this employee to leave).
-
The existence of a Positive Others influencers indicates that because there were more than 10 influencers involved in the prediction, some small positive influencers have been aggregated, resulting in a total strength of 0.06.
This dataset could be used to build the visualization below.
Understanding the Strength
The strength is a normalized representation of the contribution (impact) of the explanation “influencer=influencer value” on the prediction. The higher the absolute value of the strength the higher the impact of the explanation on the prediction.
-
For a binary prediction (classification) a positive strength increases the predicted probability while a negative strength decreases the predicted probability.
-
For a numeric prediction (regression) a positive strength will make the predicted value higher while a negative strength will make the predicted value lower.
As a normalized measure of the contribution, the strength measures how far the individual contributions are from the average contribution baseline.
More formally the strength is calculated as follow:
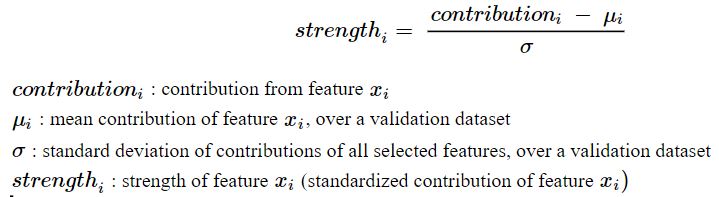
- The strength values doesn't depend on the scale or unit of the target. This is true for all the influencers, and helps you to compare the strength of two distinct influencers.
- It is possible to use thresholds to discretize the contribution into categories, such as neutral contribution and low contribution.
| Thresholds | Category |
|---|---|
| 3 <= strength | Strong positive |
| 1 <= strength < 3 | Meaningful positive |
| 0 < strength < 1 | Small positive |
| -1 < strength < 0 | Small negative |
| -3 < strength <= -1 | Meaningful negative |
| strength <= -3 | Strong negative |
Because the strength is a normalized value it cannot be interpreted in the probability space.