Run Data Action Tracing and Check Tracing Results
After tracepoints are added to an SAP Analytics Cloud data action, you can run it in trace mode to check its intermediate results at specific tracepoints and data changes between tracepoints.
Prerequisites
Tracepoints are added and data action saved.
You must have the Execute permission for the data action to run it in trace mode.
If data access control is enabled for the dimension members you want to perform the data action in trace mode on, you also need to have Write access to corresponding dimension members. For more information, refer to Set Up Data Access Control.
Context
Learning Tutorial
Click through the interactive tutorial illustrating how to debug a data action after it is built using data action tracing in step-by-step instructions (5:00 min); the tutorial is captioned exclusively in English:
Procedure
-
After the data action is successfully executed, select a tracepoint in the tracing panel and check its tracing results in the
Watch Area.
Components of Watch Area Components Description Parameters Parameters that have been set for the data action and their values selected in the prompt. For more details, see Add Parameters to Your Data Actions and Multi Actions. Variables Number variables (float and integer type variables) defined by number variables functions and their values. For details about number variables functions, see Number Variables Function. Calculation Scope The exact scope of the calculation at run time for the tracepoint, which takes the MEMBERSET scope and condition scope into account but ignores the statement scope. For details about levels of calculation scope in the advanced formulas, see Calculation Scope.
The calculation scope is shown in a list of dimensions. If there is only a single member for a dimension, its member ID will be displayed. If there’re multiple members for a dimension, the number of the dimension members will be displayed. You can click on the number to see a flat grid that shows these members.
Combined Scope
Note that when there is a condition of IF RESULTLOOKUP (…)… THEN, combinations of specific members of dimensions not specified in RESULTLOOKUP will be shown in the Combined Scope. For example:
Initial Records D.CALMONTH A.ID B.ID C.ID SignedData 201901 A1 B1 C1 2 201901 A1 B1 C2 -5 201901 A1 B2 C1 0 201901 A1 B2 C2 0 201901 A2 B1 C1 2 201901 A2 B1 C2 2 201901 A2 B2 C1 2 201901 A2 B2 C2 2 Write a script:
MEMBERSET [d/A] = ("A1", "A2")
MEMBERSET [d/B] = ("B1", "B2")
MEMBERSET [d/C] = ("C1", "C2")
MEMBERSET [d/D] = "201901"
IF RESULTLOOKUP([d/C] = "C1", [d/D] = "201901") > 0 THEN
DATA() = RESULTLOOKUP()+3
ENDIF
Based on the cell value filter defined by IF RESULTLOOKUP([d/C] = "C1", [d/D] = "201901") > 0 THEN, the records that meet the condition are highlighted:Records Meeting the Condition D.CALMONTH A.ID B.ID C.ID SignedData 201901 A1 B1 C1 2 201901 A1 B1 C2 -5 201901 A1 B2 C1 0 201901 A1 B2 C2 0 201901 A2 B1 C1 2 201901 A2 B1 C2 2 201901 A2 B2 C1 2 201901 A2 B2 C2 2 The combinations of specific members of dimensions not specified in RESULTLOOKUP (combined scope) are shown as follows:
A.ID B.ID A1 B1 A2 B1 A2 B2 Together with the MEMBERSET scope for dimension C and dimencion D, we will get the following new records after the script is executed:
New Records D.CALMONTH A.ID B.ID C.ID SignedData 201901 A1 B1 C1 5 201901 A1 B1 C2 -2 201901 A1 B2 C1 0 201901 A1 B2 C2 0 201901 A2 B1 C1 5 201901 A2 B1 C2 5 201901 A2 B2 C1 5 201901 A2 B2 C2 5 When there is a sub-component of Combined Scope, you can click next to it to see a flat grid that shows the member combinations.
Lookup Virtual variable members and their data. You can click on the number to see data displayed in a flat grid. For details about virtual variable members, see Virtual Variable Member. 
-
Click Show Table to see
data changes on the target version in the analytic window, and click (Hide Table) or Hide Table to close the window.
The analytic window is a story-like view in table layout that shows data for a specific tracepoint. You can switch between tracepoints in the Tracepoints section of the tracing panel to see data changes between a tracepoint and the previously selected one, which are highlighted in the table.

When you access the analytic window for the first time, you need to configure rows, columns, and filters for the table just like you do for a normal table in a story. Note that these configurations will stay the same whenever you switch between different tracepoints. They will remain as before even when you close the analytic window and open it again.
NoteTo copy selected data from the analytic window to the clipboard, you can either choose Copy in the upper right corner or use the following keyboard shortcut: Ctrl + C (for Windows) or Command + C (for Mac).
NoteTo see a large quantity of data in table layout, we suggest you check the tracing version in the story instead of the analytic window.
NoteBy going to the version history of a tracing version, you can check the data changes for a specific tracepoint by clicking its corresponding entry that is named after the tracepoint on the timeline of the version history.
NoteWhen a version is specified in the account formulas for an account member and data action tracing is run on this version (which means it is used as the target version for tracing), there will be differences between the records for this version shown in the analytic window and those for the tracing version shown in the story.
For example, the account member Account F is calculated by the following formula, with Account A and Account Z being another two account members:
IF([d/Version]= "public.Actual" , [Account A] ,[Account Z] )
After the data action CarryForward_AF, which includes the Advanced Formulas Step, is run in trace mode with Actual as the target version, the following is what is shown in the analytic window:
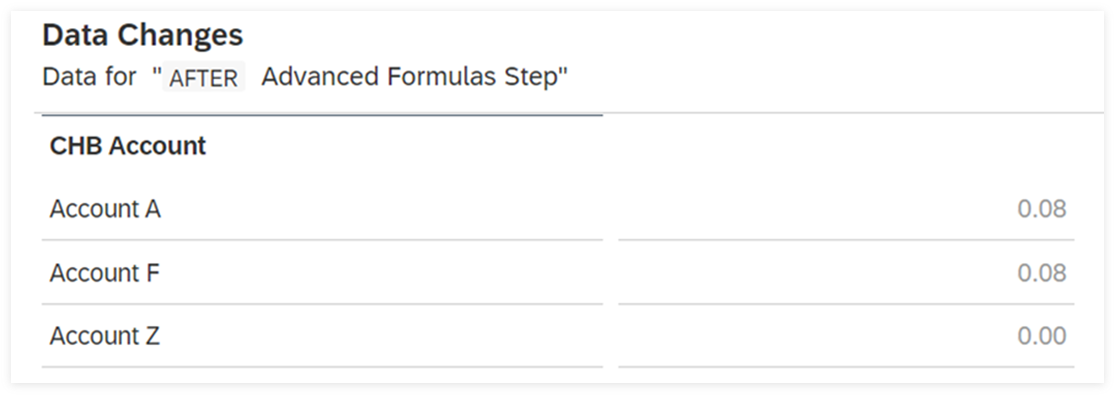
Here the value of Account F equals to that of Account A.
By contrast, the following is what is shown in the story:
In the tracing version that is automatically created by data action tracing, the value of Account F equals to that of Account Z, which means the tracing version is treated as a different version from Actual.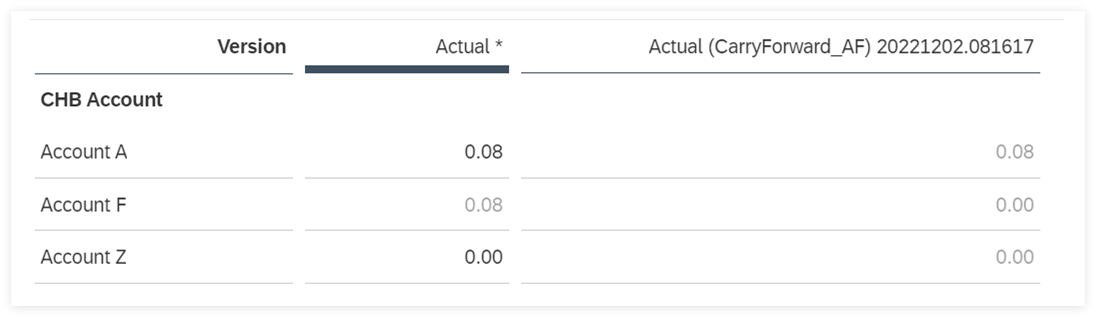 Note
NoteIn the tracing analytic window, the data records are always shown in the default currency and currency conversion values (they are not in the default currency) are not shown for tracing versions shown in the story. Note that this only applies to classic account models. For example:
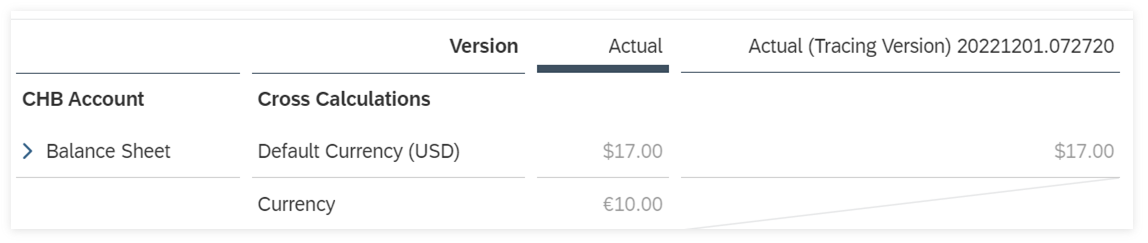
As you can see in the table, the value of Balance Sheet in Currency for the tracing version is not shown. By contrast, the currency conversion value is shown for the Actual version.
-
To navigate an embedded data action step for tracing purpose, do the following.
Navigate to an embedded data action by selecting the corresponding embedded data action step and clicking
 (Open embedded data action) next to its name. Then
you can add tracepoints for the embedded data action.
(Open embedded data action) next to its name. Then
you can add tracepoints for the embedded data action. Click Run to run the embedded data action in trace mode. You can then check the tracing results in the Watch Area section. Note that if you just run the embedded data action in trace mode this way, the data action that embed it is not run. If you navigate back to the embedded data action step and click Run, the whole data action, including the embedded data action, will run in trace mode.
Note that no tracepoint count is available for the embedded data action step in the left pane of the data action page. When you navigate to the embedded data action, you can see the tracepoint counts for the advanced formulas steps included in it.
Next Steps
You can edit and refine your data action based on tracing results, so that it works as you desire.