About Planning
With SAP Analytics Cloud, you can cover a range of planning operations like scheduling tasks, kickstarting forecasts with predictive features, building custom planning applications, carrying out data entry and version management, and writing powerful scripted calculations.
As you’re working in the application, you can collaborate with your team and apply advanced analytics to your planning data. This way, you know that everyone’s aligned on the same goal, and you can get more value out of your plan.
What Is Planning?
Reporting and analysis often focuses on historical data (known as actuals), but a business needs a clear vision of the future, too.
Planning is all about setting strategic goals and then determining how to meet those goals by creating annual budgets, tracking progress in forecasts, and simulating scenarios to find new opportunities. These plans are formed by projecting actuals into the future, by gathering input from different departments, and by considering trends, risks, and opportunities in the market.
Executive boards and finance departments play a big role in planning. But an effective plan needs input and support from the whole organization. Maintaining close integration between departmental plans and the overall strategic goals and financial plans is known as collaborative enterprise planning.
Roles Involved in Planning
-
Planning modelers: These specialists have a strong understanding of the organization’s data and the other systems in their landscape. They’ll play a big role in setting up the planning solution in SAP Analytics Cloud, including creating models and structured planning operations.
-
Planning reporters: These users can be finance specialists who are working with the data on a daily basis to create budgets and forecasts, and to provide financial reports and analysis to business users and upper management.
Planning reporters also include many users who just need to contribute planning data for their specific area as part of a bottom-up planning process.
- Planning viewers: These are stakeholders in the planning process, such as business users and executives, who need to check to see how their team or organization is doing. Sometimes they might run their own simulations or contribute some planning data as part of a calendar task.
How Planning Fits into SAP Analytics Cloud
Applying analysis and predictive features while you're planning can help you plan faster and more accurately, and get a better understanding of your business.
For example:
-
When starting a plan, you might use predictive scenarios to set the initial values, letting you quickly identify the overall trend as well as expected fluctuations in your data. The predicted values give you a quick start that's grounded in past performance.
-
While you're adjusting this plan with manual data entry, you might refer to overall KPIs as well as variance charts for each data point to get quick feedback about whether the plan is on target or not.
-
If you want to understand the trends and drivers in your data, or investigate the root cause of a specific issue, you may want to do some free-form exploration of your data, and analyze it with smart features that identify key influencers and outlying data points.
You can integrate these features closely with the planning process so that data analysis, manual planning, and predictive features all reinforce each other without making your process slower or more complicated.
The Planning Process
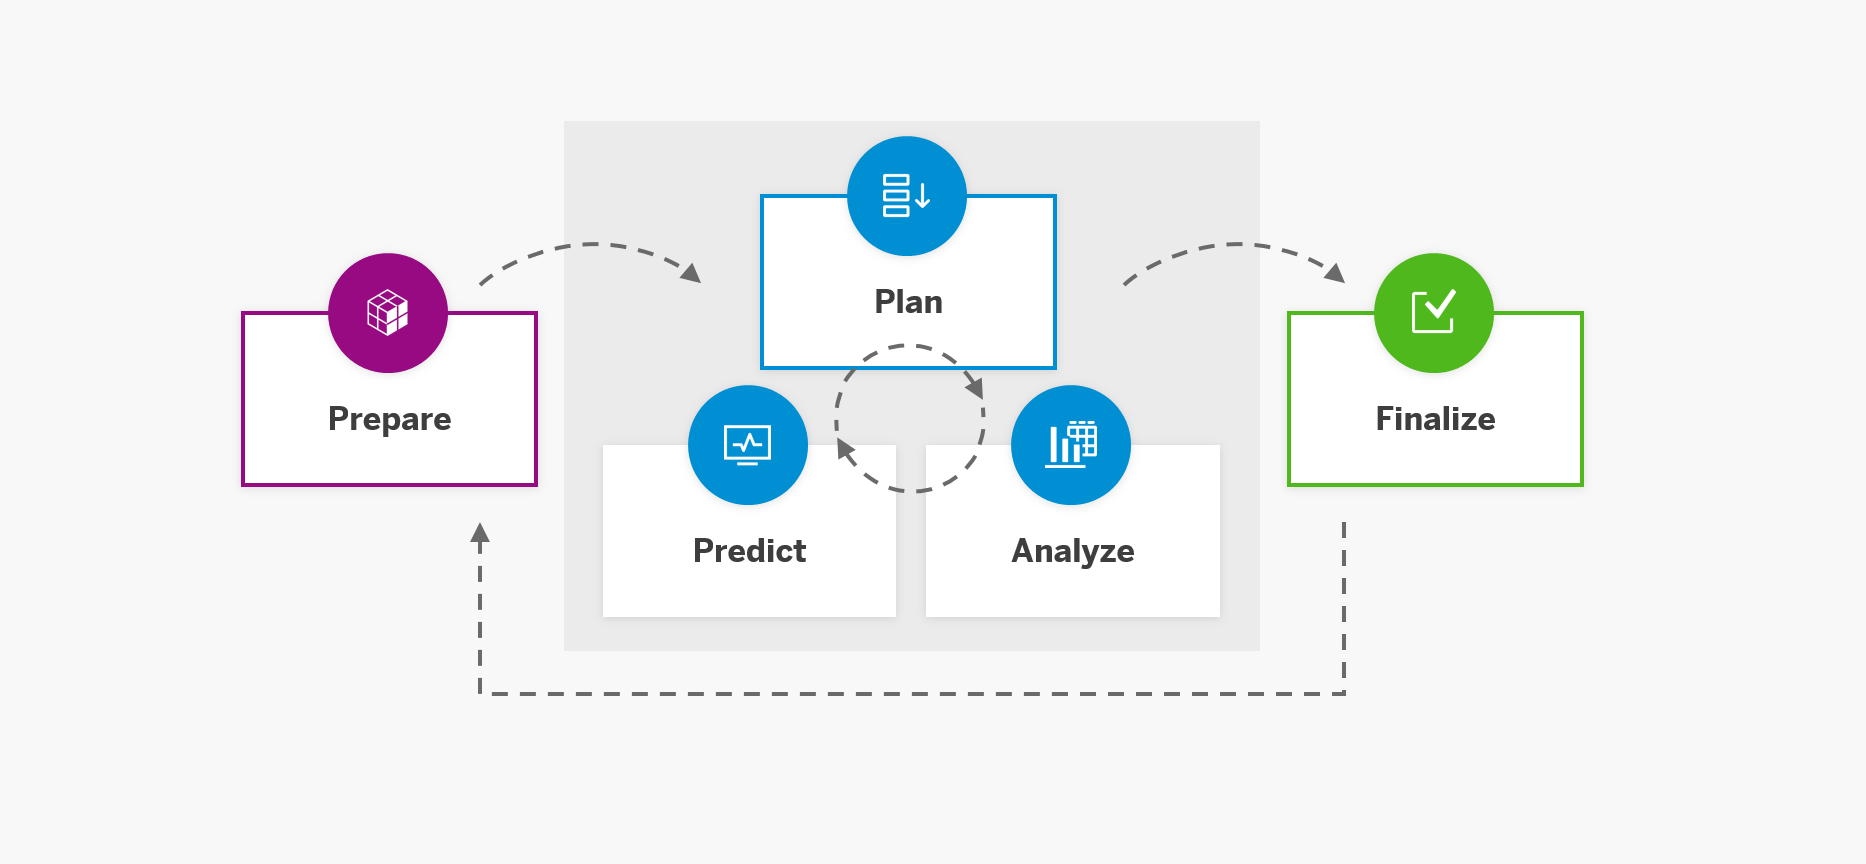
Planning processes are collaborative, cyclical, and iterative. Broad phases in a planning cycle include preparing the solution, planning, and finalizing the data:

Your organization might start a new cycle shortly afterwards, especially for rolling forecasts. You might also have simultaneous planning cycles running at different levels, such as an annual budget and quarterly forecast.
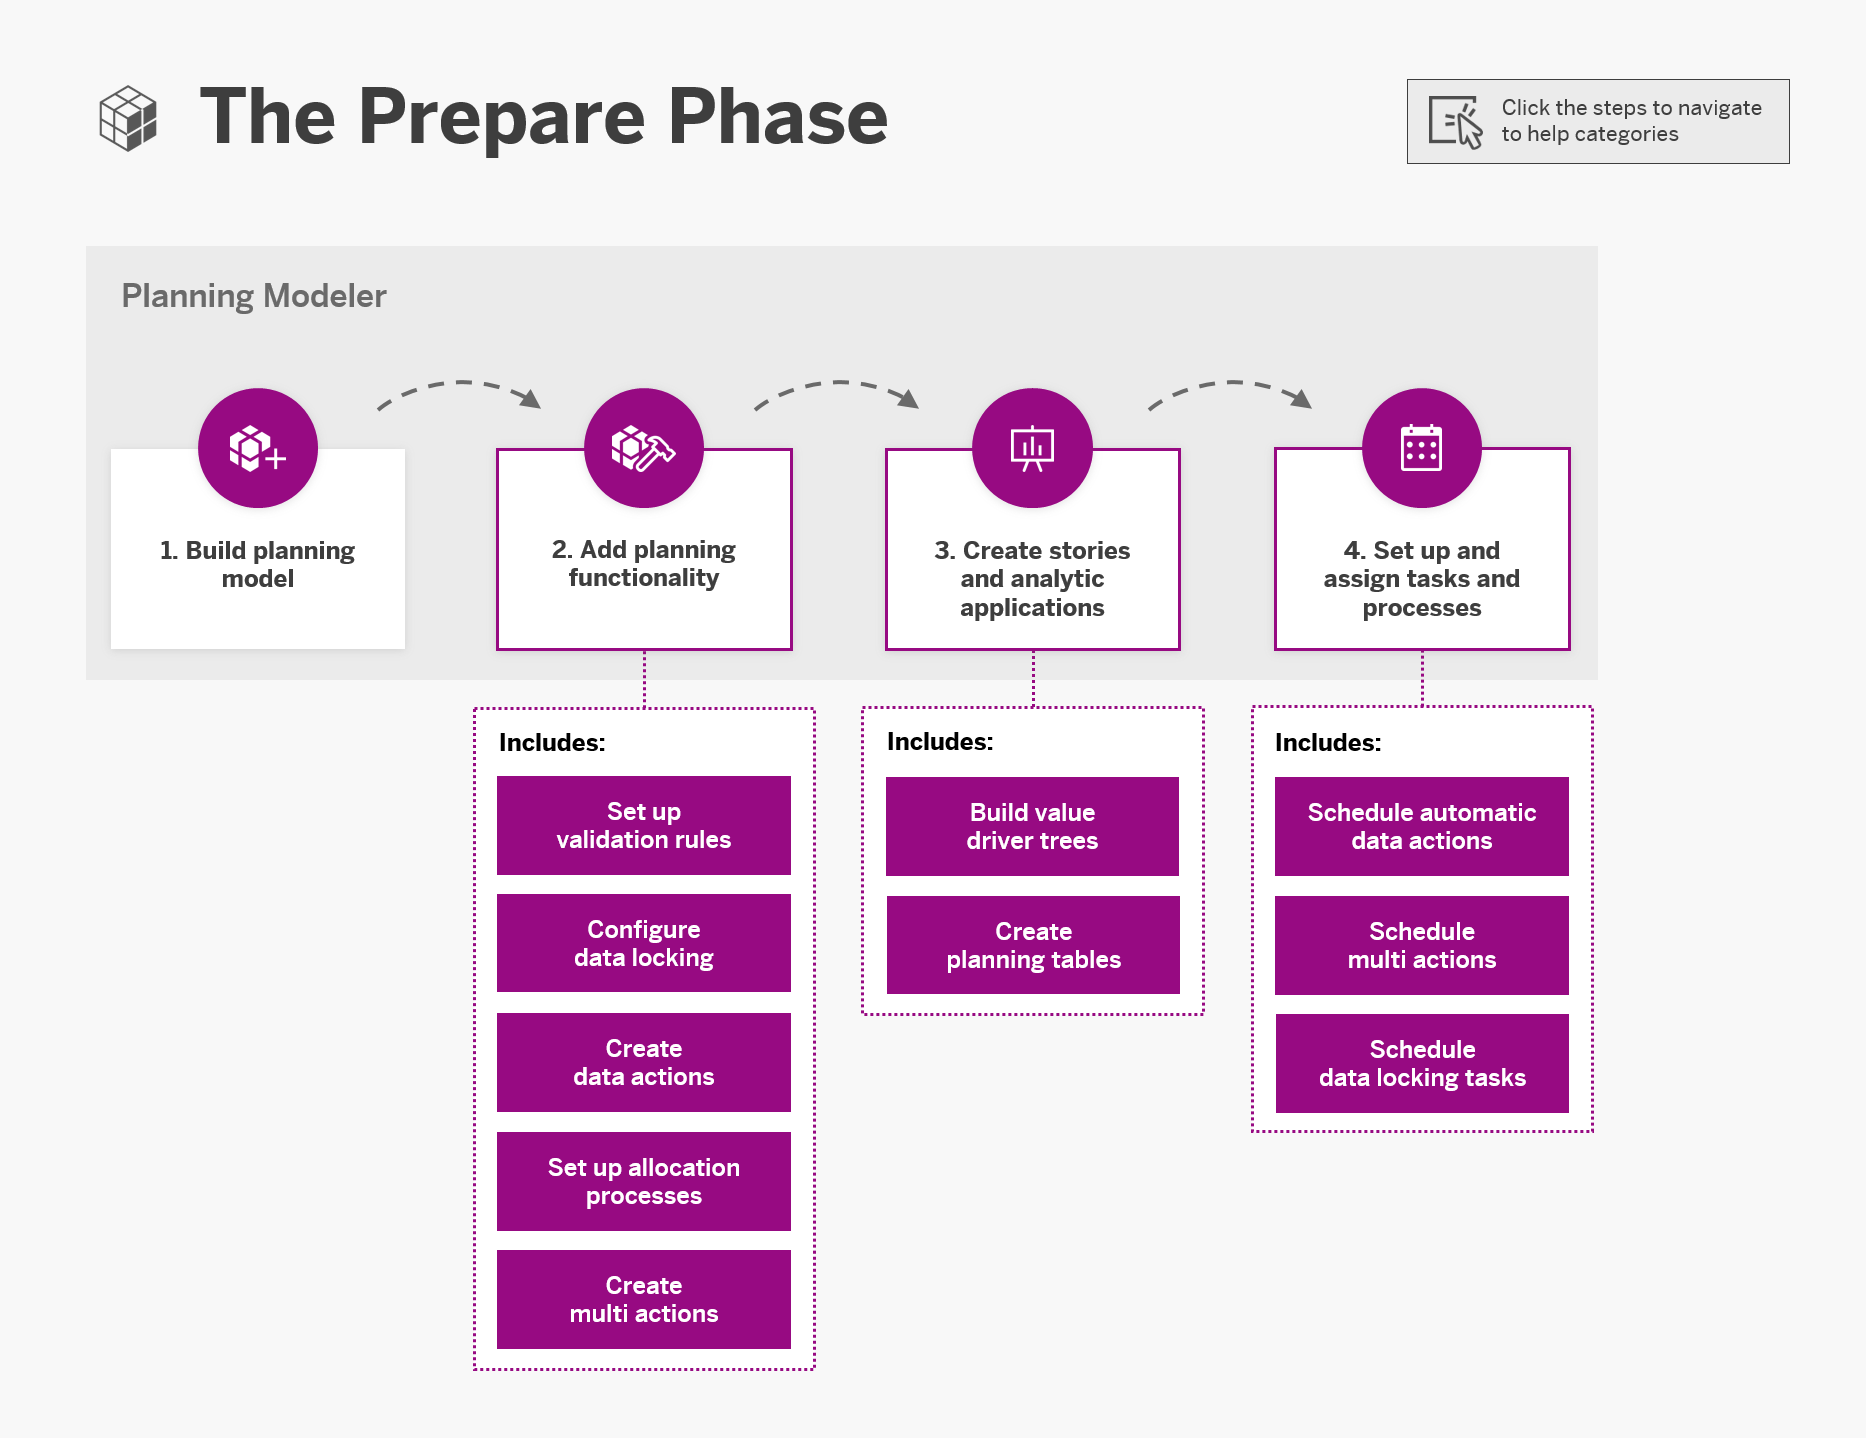
The Prepare Phase
Planning modelers do most of their work in this phase. After the initial setup of the solution, they can update and enhance it during later cycles.
Use this diagram to get descriptions of each step and click to open detailed instructions.

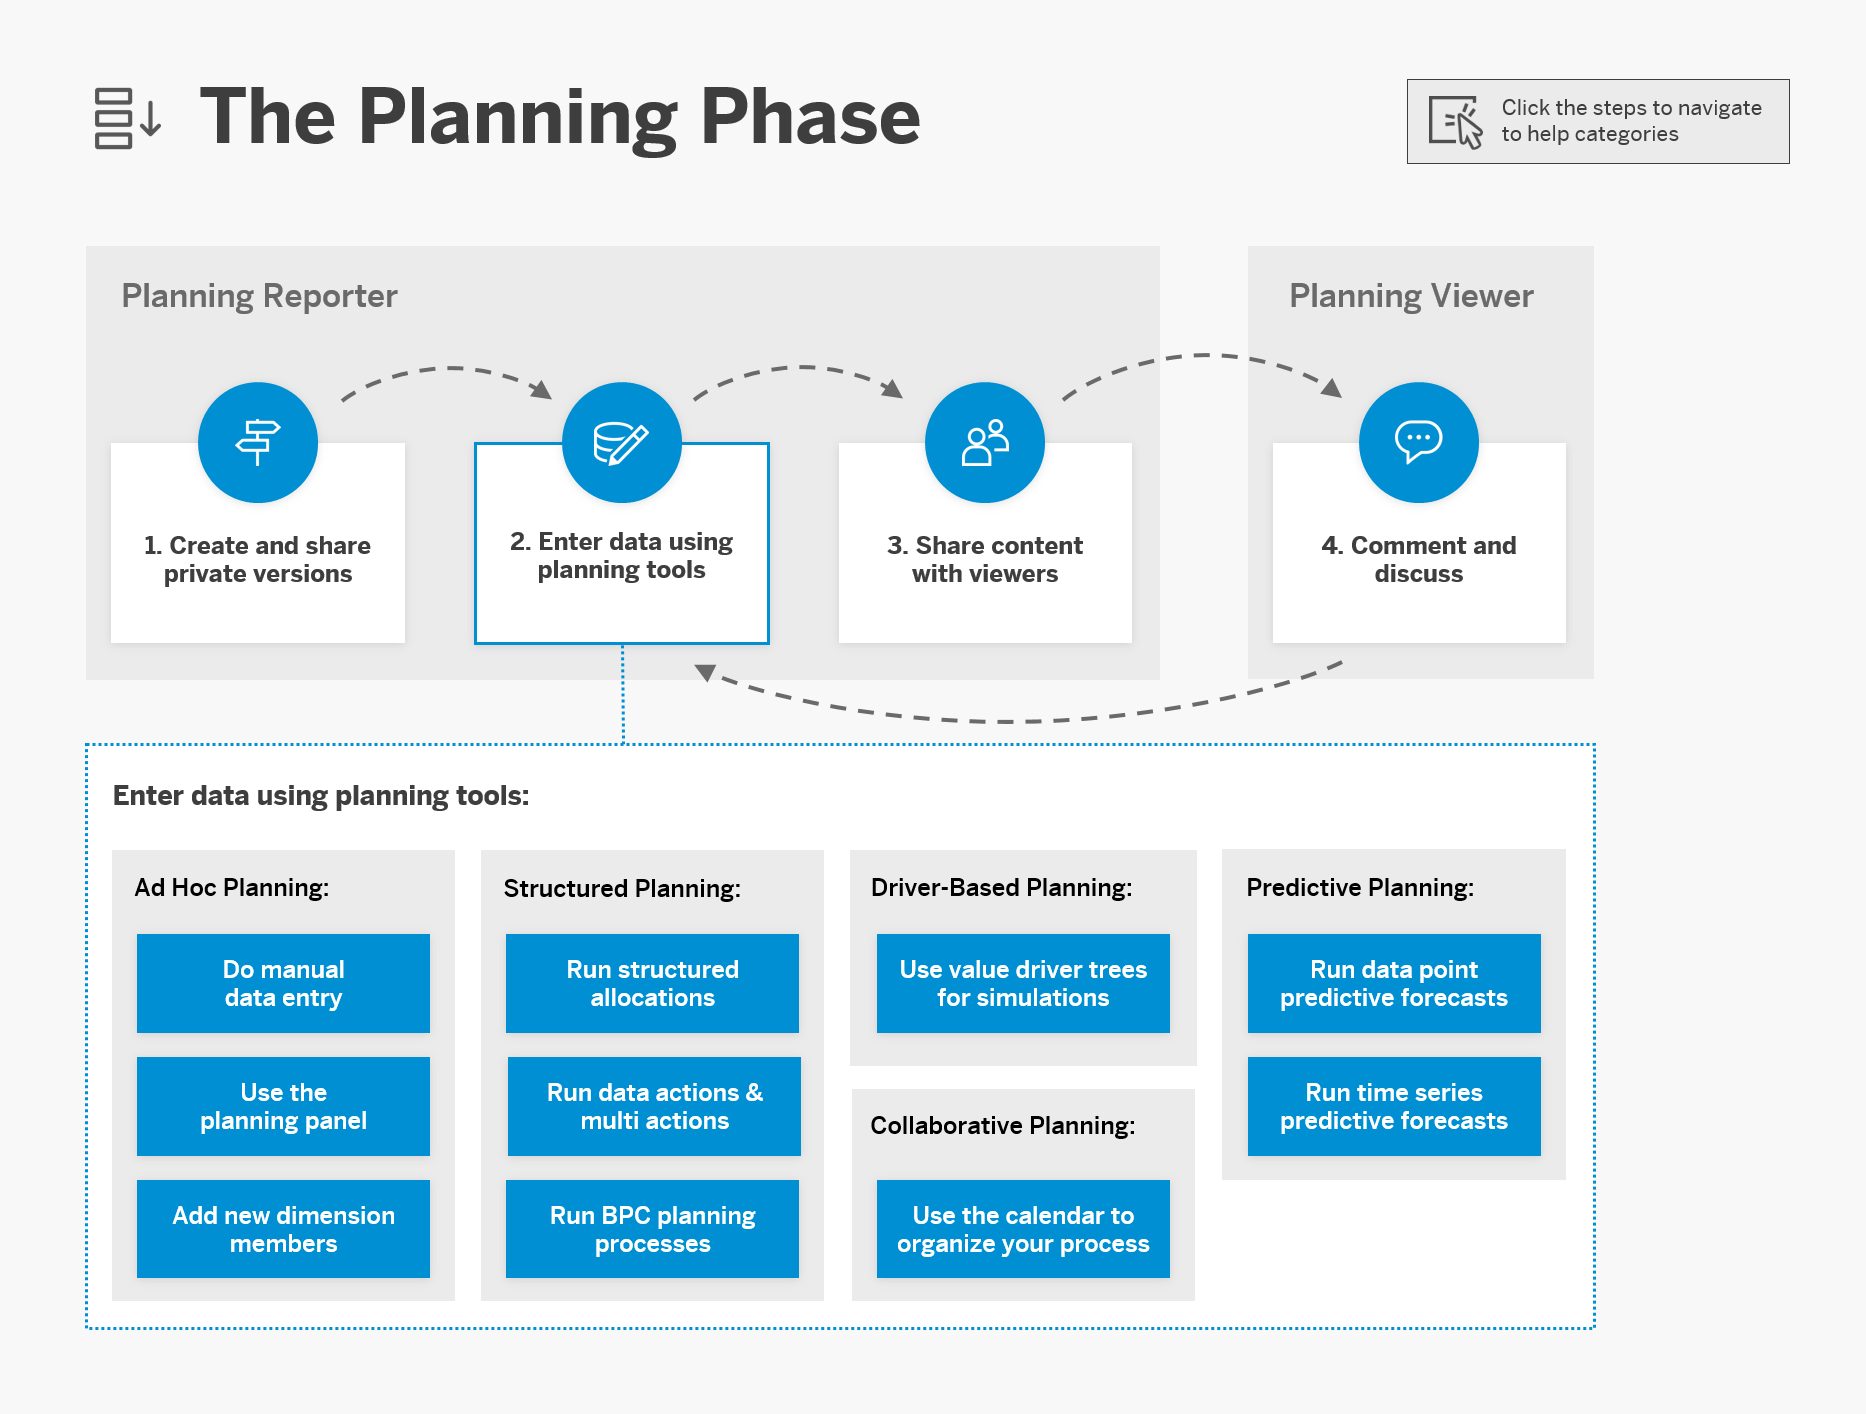
The Planning Phase
Next, planning reporters work to putting the figures into the plan, and sharing their work with viewers.
Use this diagram to get descriptions of each step and click to open detailed instructions.

There are often iterative changes in this part of the process as planners and stakeholders at different levels and in different departments collaborate on the plan.
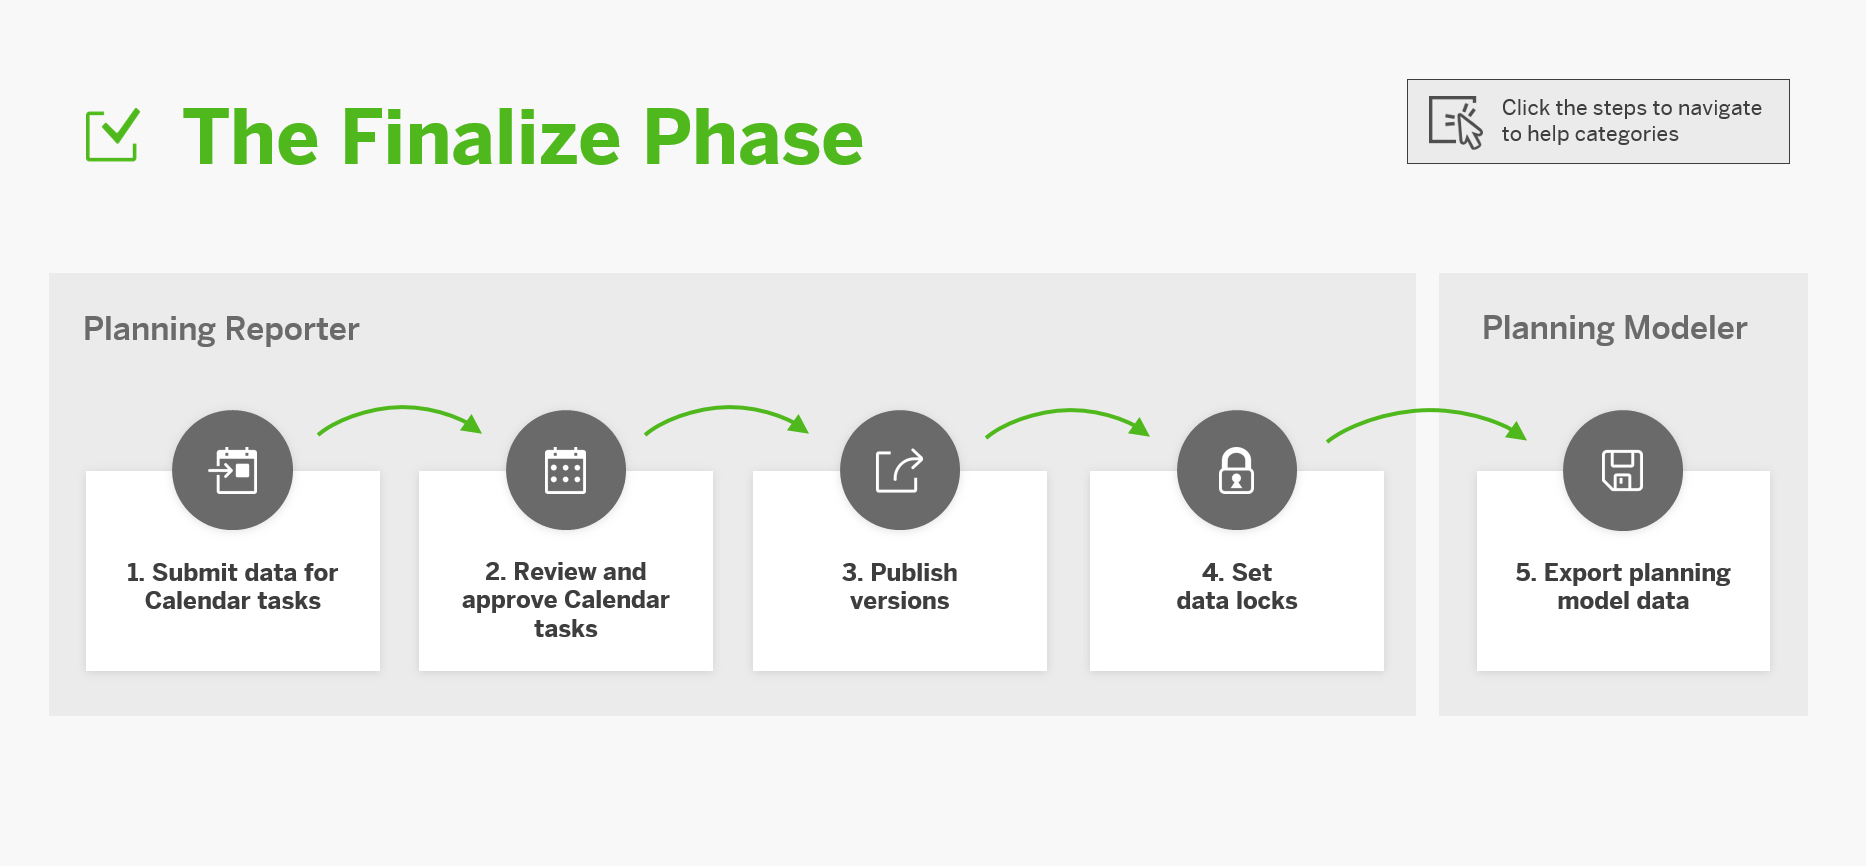
The Finalize Phase
This image is interactive. Hover over each area for a description. Click highlighted areas for more information.

When the data is ready, there are a few steps to wrap up the process.
Other key features for planning workflows
Since SAP Analytics Cloud combines planning with analytics and predictive features, you can also support your planning workflows with several features that aren't specific to planning:
-
Tables: You'll often use tables to keep track of your data, and several planning features are based here. While working with tables, you can also customize your layout and formatting and enhance the table with calculations, data point comments, and in-cell charts. For more information, refer to Use Tables to Visualize Data.
-
SAP Analytics Cloud, add-in for Microsoft Office: If you prefer to work in Excel, you can use this add-in to connect to your SAP Analytics Cloud data, build tables, do data entry, and publish back to SAP Analytics Cloud. For more information, refer to SAP Analytics Cloud, add-in for Microsoft Office.
-
Content library: SAP and its partners provide prebuilt content here, including best practices content for planning based on S/4HANA Cloud and integrated financial planning for SAP S/4HANA. Admins can explore, import, and adapt the content to get a headstart setting up their solution. For more information, refer to Getting Business Content and Samples from the Content Network.
-
Collaboration tools: Basic collaboration tools let you share content and open discussions with other users. For focused discussion on specific data, you can use data point comments and commenting widgets. For more information, refer to Sharing, Collaborating, and Exporting.
-
Currency conversion: For international business, you can do planning and analysis with multiple currencies. For more information, refer to Plan with Currency Conversion.
-
Analytics designer: As a content creator, you might want to customize and streamline planning content to empower your end users. While stories are quicker and easier to set up, the analytics designer gives you more flexibility to create personalized analytic applications. For more information, refer to Analytic Application Design (Analytics Designer).
-
Digital Boardroom: To help figure out the big picture, you can turn your stories into interactive presentations with touchscreen support. The ability to run simulations and explore the data helps your team make strategic decisions together. For more information, refer to Digital Boardroom Presentation.