Past Target Value Contributions
The Past Target Value Contributions identify the past observations that most influence the forecast.
The Past Target Value Contributions are described in the Fluctuations section of the Explanation tab of your report.
At the step of identifying the model components, Smart Predict found that previous values of the time series have an impact on the actual values.
The Past Target Value Contributions graph shows how the target is influenced by the recent past, or distant past in the case of an autoregressive component.
The lags are numbered with negative integers representing their distance in the past from the predictive forecast. Lag -1 is the point in the past just before the forecast. Lag -2 is two points in the past.
We have
obtained the following Past Target Value Contributions graph: 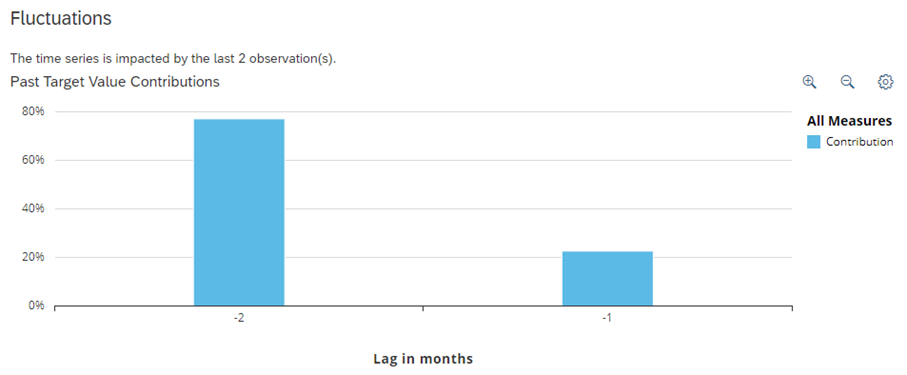
Thanks to this graph, you can identify if the ozone rate is influenced by observed values in the recent past. It also shows the most important dates. The lags are numbered with negative integers that represent how far back in the past they are from the predictive forecasts. Smart Predict found that the 2 previous values have an impact on the subsequent values. This is why the graph stops at 2. Using these lags, you can analyze how the previous values influenced the subsequent ones. Here you see that the lag -2 is more influential than the lag -1.