Analyzing the Results of Your Time Series Predictive Model
Once you've trained your Time Series predictive model, you can analyze its performance to make sure it's as accurate as possible.
Analyze the reports to get information on your predictive model composition and evaluate your predictive model performance.
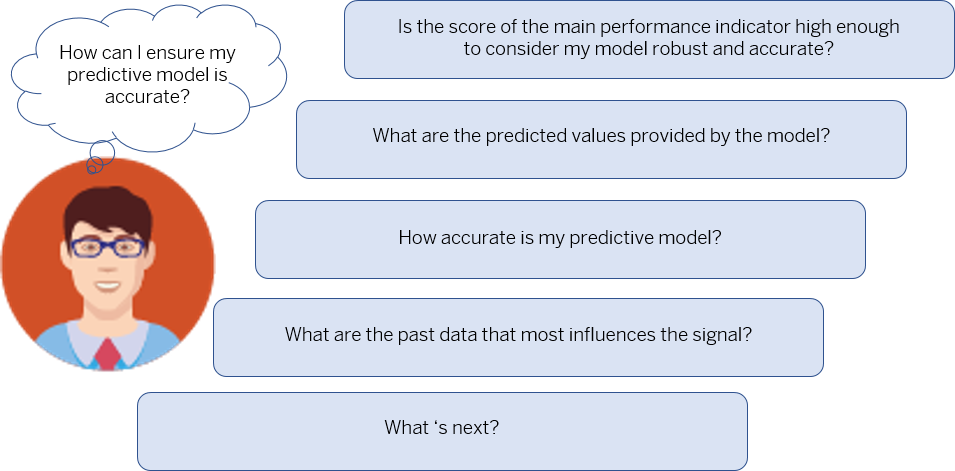
Click the area for more information.
Is the main performance indicator high enough to consider my predictive model robust and accurate?
The performance indicators evaluate the "error" that would be made if the forecast was calculated in the past where the actual values are known. Usually, the lower the performance indicator, the better your predictive model performance (except for the R² indicator).
The Expected MAPE is the default performance indicator but you can choose any of the proposed performance indicators to evaluate your model performance.
For more information, refer to Expected MAPE.
What are the predicted forecast values provided by the predictive model?
Analyze the predicted values for the predictive model over a set of known data from the training data source.
Check if there are outliers in the forecast and detect anomalies on the target.
For more information, refer to The Predictive Forecasts, The Time Series Outliers and The Time Series Outliers (Future).
How accurate is my predictive model?
Use the Forecast vs. Actual graph to visualize the predicted values (predictive forecast) and actual values (target) for the training data source. You can then quickly see how accurate your predictive model is, what are the outliers, the zone of possible errors.
For more information, refer to The Forecast vs. Actual Graph and The Time Series Outliers.
What are the past data that most influences the target?
Identify whether the target is influenced by the recent past or far past in the case of an autoregressive component.
The lags are numbered with negative integers representing their distance in the past from the forecast. Lag -1 is the point in the past just before the forecast. Lag -2 is two points in the past..
For more information, refer to Past Target Value Contributions.
What's next?
- Your are satisfied with your predictive model's performance. Then you can use it: Saving Predictive Forecasts Generated by a Time Series Predictive Model into a Dataset or Save Predictive Forecasts Back into your Planning Model.
- You would like to see if you can improve your predictive model's performance:
- Duplicate your current predictive model and experiment with updated settings. You can then compare the two versions and find the best one. See Duplicating a Predictive Model.
- Update the settings of your predictive model and retrain it.
See Define Settings and Train a Time Series Predictive Model.CautionYou will erase the previous version!
- Delete your predictive model. See Deleting a Predictive Model.