Choosing the Best Chart Type for the Data
When adding a chart to your SAP Analytics Cloud story or analytic applications page, choose the best chart type for your analysis.
You can add many charts to your story or analytic applications page, and you can have more than one chart on a page. Choose different chart types to display different aspects of your data.
Overview of Chart Types
The SAP Analytics Cloud Builder panel groups similar chart types together.
-
Comparison charts compare differences between values or show a simple comparison of categorical divisions of measures.
-
Trend charts show a trend in the data values (especially for dimensions that are time-based, such as Year) or the progression of your data and possible patterns.
-
Correlation charts show the relationship between values or compares multiple measure values.
For example, you can view the correlation of two measures and understand the impact of the first measure on the second measure.
-
Indicator charts show a business's metrics.


Bar or Column Charts
| Description | Parameters | ||||||||||||||||
|---|---|---|---|---|---|---|---|---|---|---|---|---|---|---|---|---|---|
|
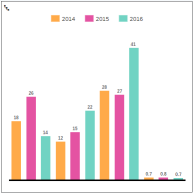
Bar or Column
Bar/Column: displays data as a series of vertical or horizontal bars. This type of chart is best suited for showing data for several sets over a period of time (for example, last year's sales figures for AZ, CA, OR, and WA). Chart Orientation: select either Horizontal or Vertical orientation. |
Number of required or optional parameters:
Measures (Accounts)
Dimensions
* When you have a measure in the Color parameter, you can have only one parameter. If you already had dimensions in the Color parameter or a different measure, the new measure will replace those parameters. |
Stacked Bar or Column Charts
| Description | Parameters | ||||||||||||||
|---|---|---|---|---|---|---|---|---|---|---|---|---|---|---|---|
|
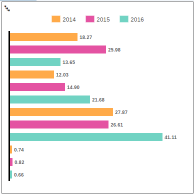
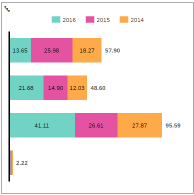
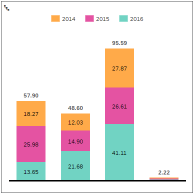
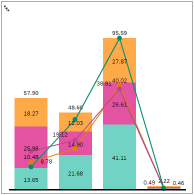
Stacked Bar or Column
Stacked Bar/Column: includes at least three series of data, each series represented by a color stacked in a single bar (for example, sales for 2014, 2015, and 2016). Tip
You only need one dimension for the stacked bar chart (as the Color parameter) and as many measures as you want. Chart Orientation: select either Horizontal or Vertical orientation. Show Chart as 100%: select when you want to show the Stacked Bar/Column chart as 100% stacked. Note
If the stacked bar or column chart has only negative values, they will be shown in a 100% stacked chart. However, if the stacked chart has both positive and negative values, when shown as a 100% stacked chart the negative values won't be shown. |
Number of required or optional parameters:
Measures (Accounts)
Dimensions
* When you have a measure in the Color parameter, you can have only one parameter. If you already had dimensions in the Color parameter or a different measure, the new measure will replace those parameters. |
Combination Column and Line Charts
| Description | Parameters | |||||||||||||||||||||||
|---|---|---|---|---|---|---|---|---|---|---|---|---|---|---|---|---|---|---|---|---|---|---|---|---|
|
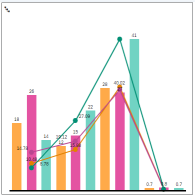
Column & Line Use a combination chart to compare two different types of data in the same chart.
Y Axes Overlap: Select when you want the bar and line axes to overlap. |
Number of required or optional parameters:
If you do not include the second axis, you will not see the Line information. Measures (Accounts)
Dimensions
|
Waterfall Charts
| Description | Parameters | ||||||||||
|---|---|---|---|---|---|---|---|---|---|---|---|
|
Waterfall Use a Waterfall chart to understand how an initial value is affected by a series of intermediate increase or decrease values. 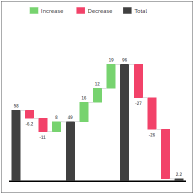
Waterfall Chart The initial and the final values are represented by columns attached to the baseline, while the intermediate values are denoted by floating columns. The columns are color-coded to show Increase, Decrease, and Total values. You can have up to two dimensions in your chart:
The initial and the final values are represented by columns attached to the baseline, while the intermediate values are denoted by floating columns. The columns are color-coded to show Increase, Decrease, and Total values. For more information on waterfall charts, see Waterfall Charts. |
Number of required or optional parameters:
Measures (Accounts)
Dimensions
Restriction
* Waterfall charts support only the Version dimension in the Color parameter. If you don't have a version dimension (for example, Actual or Forecast versions), the Color list will be empty. |
Stacked Area Charts
| Description | Parameters | ||||||||||||
|---|---|---|---|---|---|---|---|---|---|---|---|---|---|
|
Stacked Area Use a Stacked Area chart to show percentage of total sales for a limited number of regions. 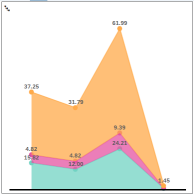
Stacked Area Chart |
Number of required or optional parameters:
Measures (Accounts)
Dimensions
|
Line Charts
| Description | Parameters | ||||||||||||||
|---|---|---|---|---|---|---|---|---|---|---|---|---|---|---|---|
|
Line 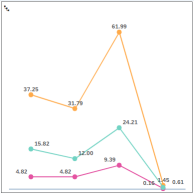
Line Chart A line chart is best suited for showing data for a large number of groups (for example, total sales over the past several years). |
Number of required or optional parameters:
Measures (Accounts)
Dimensions
|
Time Series Charts
| Description | Parameters | ||||||||||
|---|---|---|---|---|---|---|---|---|---|---|---|
|
Time Series 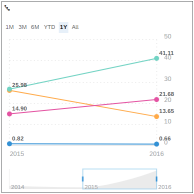
Time Series Chart Each point on a time series chart corresponds to both a time and a quantity. This chart type can be used to view sales revenue trends of a product throughout a range of years. |
Number of required or optional parameters:
Measures (Accounts)
Dimensions
|
Box Plot Charts
| Description | Parameters | ||||||||||||||
|---|---|---|---|---|---|---|---|---|---|---|---|---|---|---|---|
|
Box Plot A box plot chart displays data based on the five-number summary: the minimum, the maximum, the median, and the first and third quartiles. 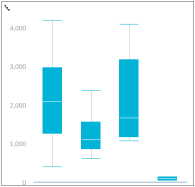
Box Plot Chart Use a Box Plot chart to summarize annual sales amounts according to geographical regions. For each country, plot a box that shows the range and distribution of the regional sales amounts within that country. A box plot chart usually includes two parts: a box and a set of whiskers.
Tip
SAP Analytics Cloud follows Excel's Quartile.INC() function behavior for computing quartiles. |
Number of required or optional parameters:
Measures (Accounts)
Dimensions
|
||||||||||||||
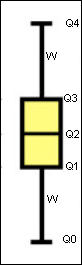 |
In addition to the minimum and maximum values used to construct a box plot chart, another important element is the interquartile range (IQR). The IQR is the distance between the upper and lower quartiles (Q3-Q1). |
Heat Map Charts
| Description | Parameters | ||||||||||||
|---|---|---|---|---|---|---|---|---|---|---|---|---|---|
|
Heat Map 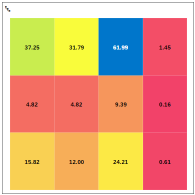
Heat Map Chart A heat map (or heatmap) is a data visualization technique that shows magnitude as color in two dimensions. The variation in color in a heat map may be by hue or intensity, giving visual cues to the reader about how the phenomenon is clustered or varies over space. |
Number of required or optional parameters:
Measures (Accounts)
Dimensions
|
Histogram Charts
| Description | Parameters | ||||||||||||||
|---|---|---|---|---|---|---|---|---|---|---|---|---|---|---|---|
|
Histogram Use a Histogram chart to indicate the number of data points that lie within a range of values. 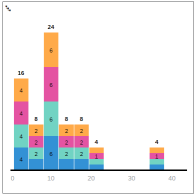
Histogram Chart |
Number of required or optional parameters:
Measures (Accounts)
Dimensions
Bin Properties
|
Radar Charts
| Description | Parameters | ||||||||||||
|---|---|---|---|---|---|---|---|---|---|---|---|---|---|
|
Radar 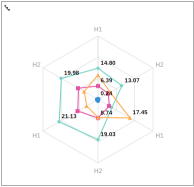
Radar Chart The Radar chart places numeric values, increasing in value, from the center of the radar to the perimeter. Radar charts are particularly useful for determining how specific values relate to group data. |
Number of required or optional parameters:
Measures (Accounts)
Dimensions
|
Tree Map Charts
| Description | Parameters | ||||||||||||
|---|---|---|---|---|---|---|---|---|---|---|---|---|---|
|
Tree Map 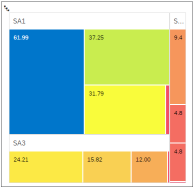
Tree Map Chart A Tree Map chart displays data as a series of hierarchical rectangles, where the surface area of each rectangle is proportional to the size of a value from the data object; the larger the rectangle, the greater the value that it represents. In a tree map chart, the Label dimensions are shown as nested groups, with the first dimension as the outermost group. Use the Size measure for size and color, or add a separate Color measure. |
Number of required or optional parameters:
Measures (Accounts)
Dimensions
|
Bubble Charts
| Description | Parameters | ||||||||||||||||||
|---|---|---|---|---|---|---|---|---|---|---|---|---|---|---|---|---|---|---|---|
|
Bubble Use a Bubble chart to show the number of products sold in a certain region; the larger the bubble, the greater the number of products sold in that region. 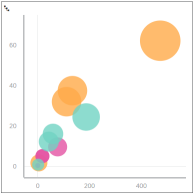
Bubble Chart |
When you have a measure in the Color parameter, you can have only one parameter. If you already had dimensions in the Color parameter or a different measure, the new measure will replace those parameters. Number of required or optional parameters:
Measures (Accounts)
Dimensions
|
Cluster Bubble Charts
| Description | Parameters | ||||||||||||
|---|---|---|---|---|---|---|---|---|---|---|---|---|---|
|
Cluster Bubble 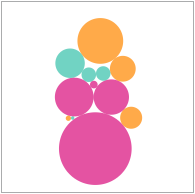
Cluster Bubble Chart In cluster bubble charts (also called packed bubble charts), the size and the color of the bubbles are used to visualize the data. The positioning of the bubbles is not significant; however, the chart is optimized for compactness. |
Number of required or optional parameters:
Measures (Accounts)
Dimensions
|
Scatterplot Charts
| Description | Parameters | ||||||||||||||
|---|---|---|---|---|---|---|---|---|---|---|---|---|---|---|---|
|
Scatterplot 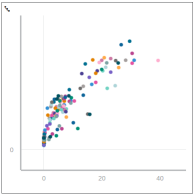
Scatterplot Chart The scatterplot chart allows the user to consider a larger scope of data for the purpose of determining trends. For example, if you input customer information, including sales, products, countries, months, and years, you would have a collection of plotted points that represents the pool of customer information. Viewing all of this data on a scatterplot chart would allow you to speculate as to why certain products were selling better than others or why certain regions were purchasing more than others. |
When you have a measure in the Color parameter, you can have only one parameter. If you already had dimensions in the Color parameter or a different measure, the new measure will replace those parameters. Number of required or optional parameters:
Measures (Accounts)
Dimensions
|
Bullet Charts
| Description | Parameters | ||||||||||
|---|---|---|---|---|---|---|---|---|---|---|---|
|
Bullet 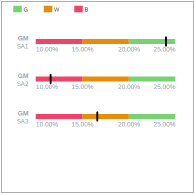
Bullet Chart A bullet chart is a variation of a bar chart, and is similar to progress charts. The bullet chart compares a single, primary measure (for example, current year-to-date revenue) to one or more other measures (for example, compared to a target), and displays the result as a threshold or set of ranges. |
Number of required or optional parameters:
Measures (Accounts)
For bullet charts, the Color element uses thresholds. You can compare a measure to a number range or to another number. Dimensions
|
Numeric Point Charts
| Description | Parameters | ||||||
|---|---|---|---|---|---|---|---|
|
Numeric Point 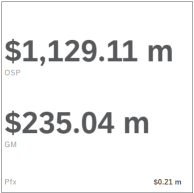
Numeric Point Chart Numeric point charts require at least one primary value, but they can have multiple primary and secondary values.
In both cases, only a single data point is displayed.
|
Number of required or optional parameters:
Measures (Accounts)
Tip
To add more emphasis to your chart, add an existing threshold to the Color element. |
Donut or Pie Charts
| Description | Parameters | |||||||||||||||||
|---|---|---|---|---|---|---|---|---|---|---|---|---|---|---|---|---|---|---|
|
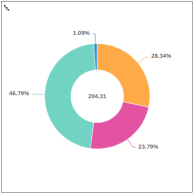
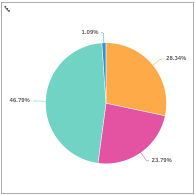
Donut or Pie Donut and Pie charts show the percentage of parts in a whole or values as ratios to a whole.
Both donut and pie charts display data as sections of a circle or donut, and both are usually used for one group of data, but can be used for multiple groups of data. Donut charts display the total numerical value in the center and the dimensions as different sized colored sections of the donut, with the size of the section representing a percentage of the total. For example, for a donut chart showing sales by region, the total number of sales (the numerical value) is in the center and the regions are the colored sections. A pie chart displays data as a pie, each section or pie wedge filled with color or patterns. Each pie wedge represents a subset of a total value. For example, the percentage of total sales divided by regions. |
Number of required or optional parameters:
Measures (Accounts)
Dimensions
|
Marimekko Charts
| Description | Parameters | ||||||||||||||
|---|---|---|---|---|---|---|---|---|---|---|---|---|---|---|---|
|
Marimekko Marimekko charts use varying heights and varying column widths to depict data. 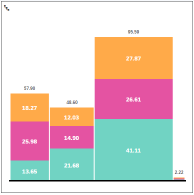
Marimekko Chart |
Show Chart as 100%: select when you want to show the chart as 100% stacked. Number of required or optional parameters:
Measures (Accounts)
Dimensions
|