What Is SAP Analytics Cloud?
SAP Analytics Cloud is an end-to-end cloud solution that brings together business intelligence, augmented analytics, predictive analytics, and enterprise planning in a single system.
Benefits of SAP Analytics Cloud
The main benefits of SAP Analytics Cloud include ease of viewing content, connectivity to trusted data, access to various visualization tools, augmented analytic capabilities, and financial planning features. In a single cloud system you can analyze, ask, predict, plan, and report.
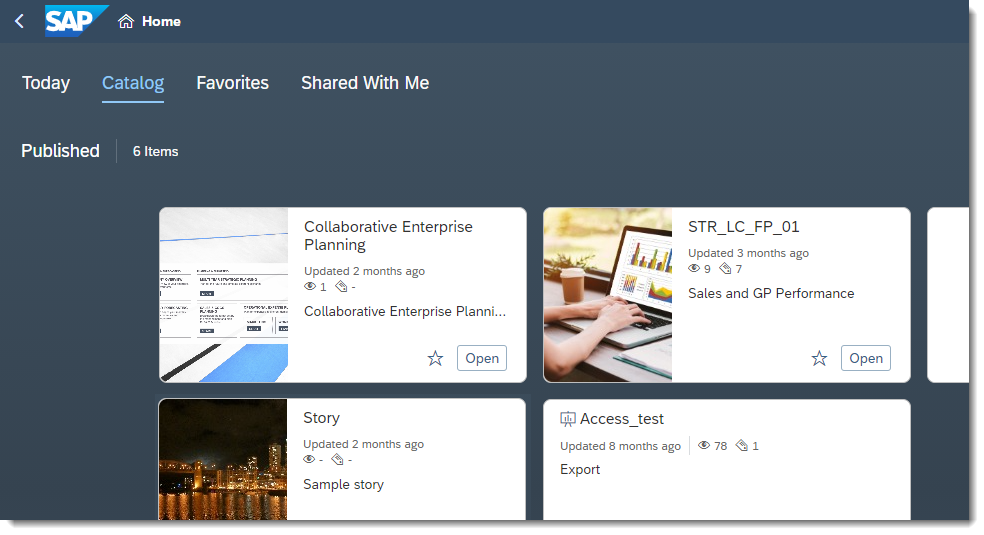
Viewing Content
- Today: default view.
- Catalog: single access point for content published for users.
- Favorites: list of resources you have saved.
- Shared with me: list of resources shared from other users.
Easily find the information you need. The catalog makes it simple for content creators to publish stories and share with the right users. In this way, even casual users (those with read permission) can quickly browse and access the content they need.
Additionally, SAP Analytics Cloud is available on mobile view so you can access stories and analytic reports while on the move.
Trusted Data
Rest assured that content is built from the right data since you can directly view the source. Securely connect to data from various spreadsheets, databases, and other applications in the cloud or on-site to make accurate data-driven decisions. Avoid the hassle of data replication by setting up live data connections. Data is "live" when a user works on a story and the changes are reflected instantly in the source system. This is convenient since in certain cases data can't be moved into the cloud due to security and privacy reasons.
Experience the seamless process of authenticating access to connected data systems and SAP Analytics Cloud by enabling Single Sign-On (SSO). You no longer need to remember multiple sign in details and service providers can now easily manage user identities.
Furthermore, keep confidential information secure by customizing access to certain folders with the access and privacy settings.
Visualization Tools
With the connected data tell a story and visualize your findings. Data visualization aids the analysis process by making data easy to understand. Use the powerful visualization tools provided by SAP Analytics Cloud to design and present your data effectively to users.
| Feature | Description |
|---|---|
 Story Designer
 |
Explore, analyze and visualize data to get actionable insights for decision making. Create stories by visualizing data with charts, tables, Geo-mapping and pictogram diagrams. |
 Modeler
 |
Represent data of an organization or business segment in a model. You can use a model as the basis for your story. |
 Business Content
 |
Use analytic templates created by SAP and SAP Partners to start building stories right away. |
 Analytic Applications
 |
Create custom applications and show the relationship of different UI elements. |
 Digital Boardroom
 |
Create and present real-time interactive executive meetings for fluid exchange of ideas. |
 Data Analyzer
 |
Query data directly in a pivot-table style view. |
 MS Office Integration
 |
Analyze models built in SAP Analytics Cloud and datasets by connecting and importing to Microsoft Excel. |
Augmented Analytics
When you're analyzing a report you may wonder what influenced the variance in your data. SAP Analytics Cloud uses artificial intelligence and machine learning to provide answers to your questions.
-
Ask questions conversationally and receive instant results explained in a way you can understand without prior technical knowledge.
-
Automatically discover meaningful insights and jump-start the creation of a dashboard.
-
Use machine learning algorithms to reveal relationships in data, hidden patterns, and outliers in your data.
-
Forecast and predict potential outcomes, then populate a table or graph from the results into your plan.
| Feature | Description |
|---|---|
| Search to Insight | A natural language search function that provides quick answers regarding stories. |
| Smart Insight | A panel besides your story that provides further insights into a data point or variance. |
| Smart Discovery | Explore your data in a specific context to uncover new or unknown relationships between columns within a dataset. |
| Smart Predict | Formulate predictive scenarios to show possible future events or trends. |
Financial and Operational Planning
While the executive board and finance department heads are the main contributors in business planning, an effective plan requires the input of the whole organization. The planning features aid in setting goals and strategic plans that are accurate and aligned with your business. In addition, allow you to analyze budgets, forecasts and share plans across departments.
-
Abilities to plan, budget, and forecast
-
Insight into analytic findings
-
Predictions
-
Scenario planning
-
Collaboration
-
Process management
Next Steps
Now that you know more about SAP Analytics Cloud, what's next? To get started, check the following:
-
If you are a new user, get to know the interface better. Get Around SAP Analytics Cloud.
-
If you want to test out SAP Analytics Cloud before making a commitment access the free trial.
