Work with Linked Widgets Diagram in Analytic Applications
At design time, after creating linked analyses, cascading effects or filter lines in your analytic application, you can open linked analysis diagram that offers a graphic view of the relationships among widgets. You can also add or remove widgets directly on the diagram to modify the existing relationships for each widget.
About Linked Widgets Diagram
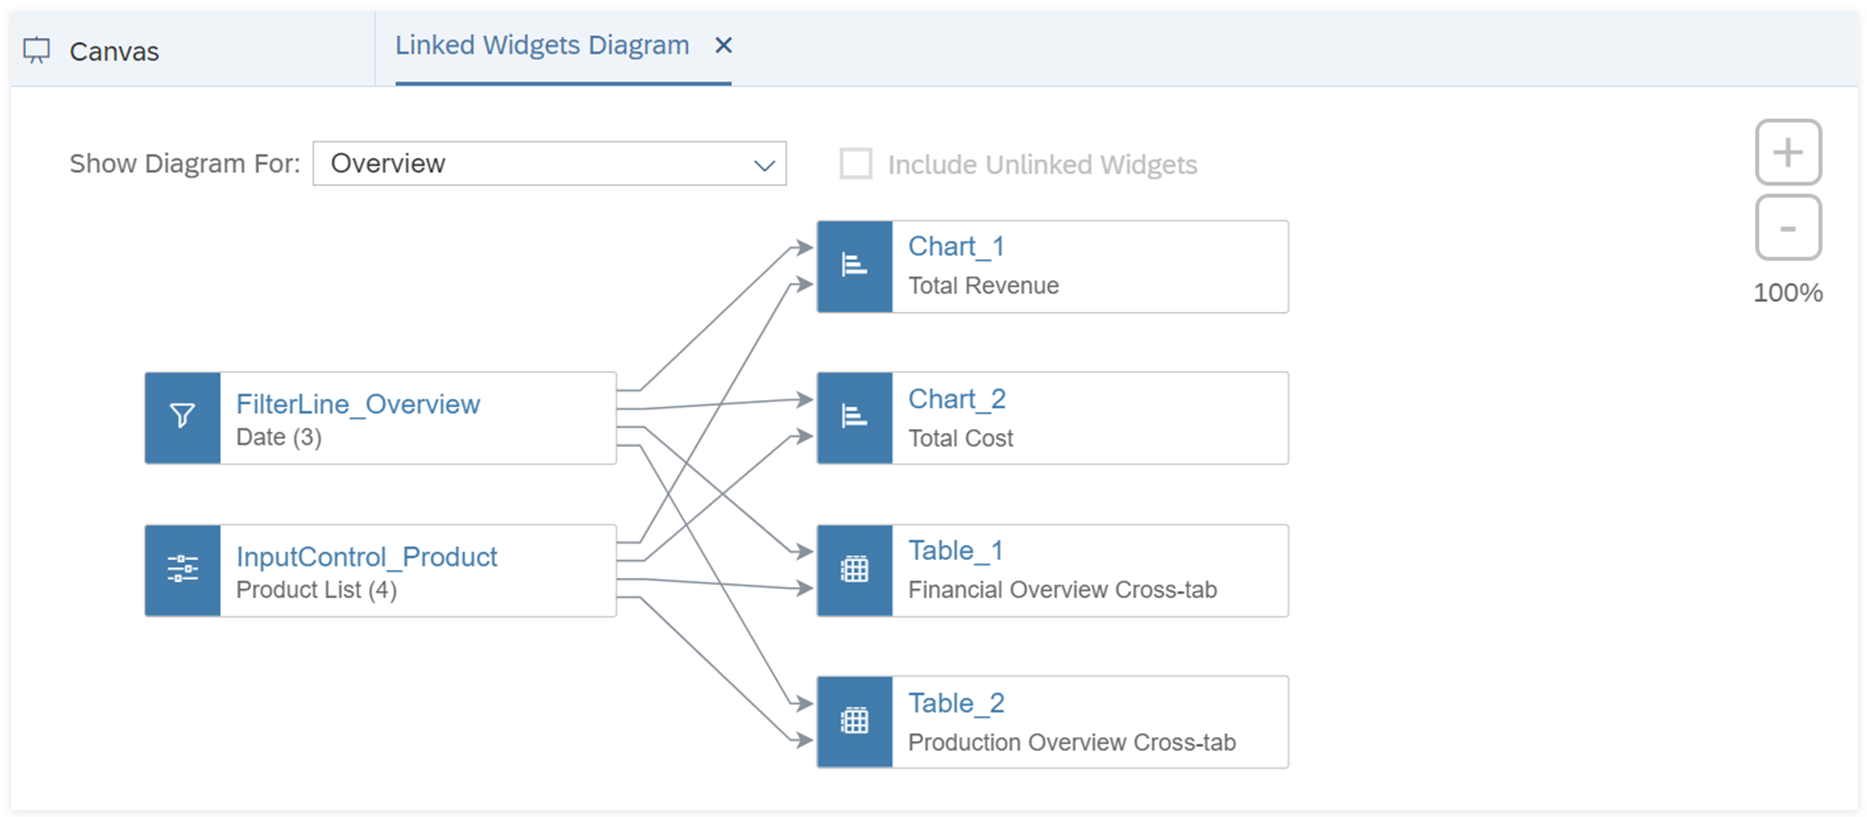
Linked widgets diagram is a graphic representation of interaction among widgets, which you can drag, zoom in on and zoom out on to view how widgets affect each other. It helps to manage relationships especially when there’re many widgets in your application.
- filter lines linked to charts and tables
- linked analyses from input controls to charts, tables, R visualizations, geo maps and value driver trees
- linked analyses from charts, tables and geo maps to R visualizations
- linked analyses among charts, tables and geo maps
-
cascading effects, relationships among input controls
NoteMake sure cascading effect is turned on in the input controls’ context menu if you want to modify the relationships on the diagram.
The links created via scripting and widgets without data source won't be shown on linked widgets diagram.
Invisible widgets can be shown on the diagram but are greyed out.
Unlike filter line and linked analysis, which can only set widgets to be affected, this interactive diagram lets you set all the linked widgets to a specific widget, which include:
- source widgets, whose changes will affect other widgets to re-render
- target widgets, which will be affected by changes in other widgets
To trigger linked widgets diagram, do either of the following:
-
From Tools in the analytic applications toolbar, select Linked Widgets Diagram.
For the first time to open, you’ll see an overview page with all the linked widgets in your application. If you reopen the diagram, it’ll stay in the previous state.
-
From the
 (More Actions)
menu of a widget, select
(More Actions)
menu of a widget, select  Linked Analysis
 Diagram View.
You’ll see all its linked widgets.
Each widget on the diagram is represented by a node with widget icon and ID. When you hover over a widget, you can see its ID and, if applicable, full title, visibility status and filters in detail on its tooltip.
Besides, when you hover over a link between the two widgets, you’ll see a tooltip indicating the relationship, either Linked Analysis, Filtering from Filter Line or Cascading Effect.
View and Manage Linked Widgets
With linked widgets diagram, you can both view and modify the existing widget relationships.
To view linked widgets to a specific widget, you can directly select its ID from the dropdown. You’ll see all its source and target widgets on the diagram.
You can do the following actions in a widget’s context menu:
| Option | Description |
|---|---|
| Manage Linked Widgets | Manage linked widgets to the selected central widget. A panel will open where you can add or delete its source or target widgets (also available for all widgets in overview). |
| View Linked Widgets | Switch to the selected source or target widget to view its linked widgets (also available for all widgets in overview). |
| Remove Link | Remove the selected source or target widget from the existing relationship. |
| Switch to Overview | Switch to overview to view relationships among all widgets in your application. |
- Filter lines can only be source widgets.
- Only input controls can be input controls’ source widgets.
- Time series charts, waterfall charts and histograms can only be target widgets.
- Value driver trees don’t have target widgets, and only input controls can be source widgets.
- R visualizations don’t have target widgets, and filter lines can’t be configured as source widgets.
Besides, when you mouse over a widget, you can select + icon on either side to directly add its source or target widgets. The dropdown also lets you switch to overview or any widget for viewing and managing relationships.
Filter lines in individual widget filter mode aren’t supported for adding or removing links.
In the relationships overview, you can select Include Unlinked Widgets to see whether any widgets need to be added to the existing relationships.
Note that when you open a popup, the linked widgets diagram tab will disappear with the canvas tab, but it will reappear when you switch back to canvas.