Navigate Within Stories
Did someone share a story with you? Explore the menu options and objects on the SAP Analytics Cloud story page. You can use these tools to make sense of your data!
Here's an overview of the main menu options that you can find within a story in SAP Analytics Cloud:
Toolbar Types: Edit Mode, Story Details
The following table is a comparison of the collapsed and expanded toolbar layouts. Compared to the collapsed layout, the options may be in a different order when the toolbar is expanded.
| Toolbar Type |
|---|
Collapsed  |
Expanded  Note
The options displayed in the expanded toolbar may vary. For example, you may see the Insert (2) options instead of the File (1) options on the toolbar. |
| Key | Option |
|---|---|
| 1 | File |
| 2 | Insert |
| 3 | Tools |
| 4 | Data |
| 5 | Format |
| 6 | Display |
| 7 | More |
The following table shows the order of the options when the toolbar is collapsed.
Options that have “planning models only” next to their names are only available if a planning model is added to your story.
| Menu/Functionality | Description/Submenu |
|---|---|
File (1) 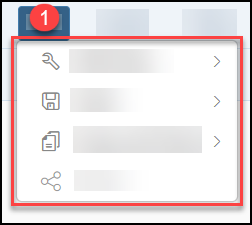 |
 Edit Story:
 Save:
Save:
 Copy and Paste:
 Share:
|
Insert (2) 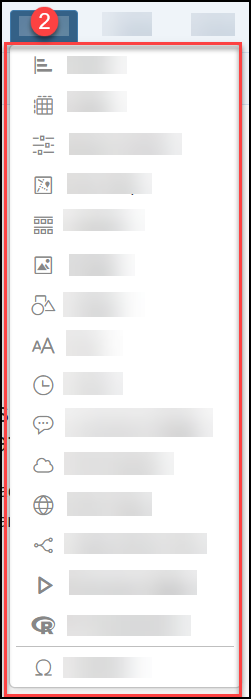 |
|
Tools (3) 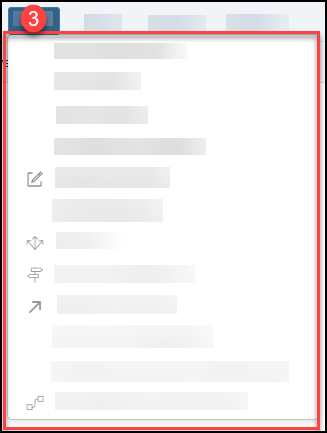 |
Story Filter/Prompt Formula Bar Chart Scaling Conditional Formatting
Smart Discovery
Value Lock Management Set/unset read only for selected cells.
|
Data (4) 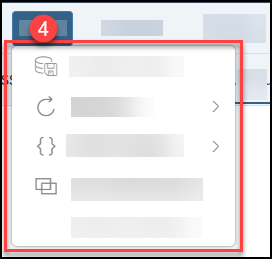 |
 Publish Data
 Refresh:
 Edit Prompts:
Version History (planning models only) |
Format (5)  |
Layouts |
Display (6) 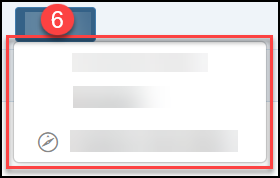 |
Comment Mode Examine
|


Toolbar Types: Edit Mode, Data Details
The following table is a comparison of the collapsed and expanded toolbar layouts. Compared to the collapsed layout, the options may be in a different order when the toolbar is expanded.
| Toolbar Type |
|---|
Collapsed 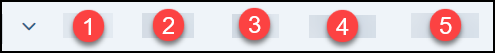 |
Expanded  |
| Key | Option |
|---|---|
| 1 | File |
| 2 | Mode |
| 3 | Data |
| 4 | Display |
| 5 | Actions Note
This option will appear on your toolbar if you added a dataset. |
The following table shows the order of the options when the toolbar is collapsed. The options may be in a different order when the toolbar is expanded.
For options that have “Grid View for datasets only” included next to their names, it means that they are only available if your
added data source is a dataset and you have enabled  Grid View.
| Menu/Functionality | Description/Submenu |
|---|---|
File (1) 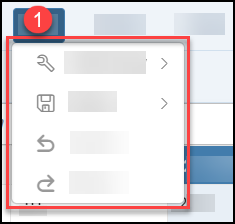 |
Edit Story:
Save:
|
Mode (2) 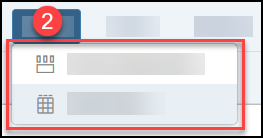 |
Grid ViewNote
If you do not have a dataset added and you have added a public or embedded live connection model, you will not see the Grid View option. Instead, you will see the following message: Data preparation is unavailable for public and embedded live connection models. |
Data (3) 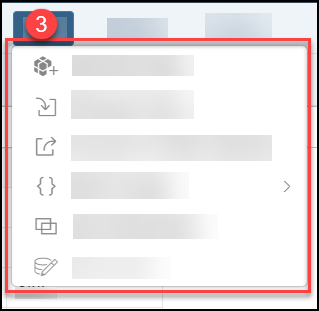 |
Edit Prompts:
|
Display (4) 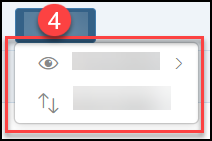 |
 Show/Hide:
Note
If your added data source is a dataset and you have enabled Grid View, you will see
 Sort with the following options in your Display dialog
instead:
Sort with the following options in your Display dialog
instead:
|
Actions (5) Note
This option would appear on your toolbar if you added a dataset and enabled Grid View. 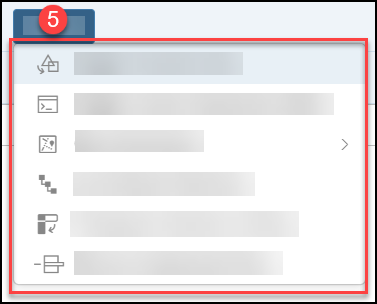 |
 Geo Enrichment:
|


Toolbar Types: View Mode, Story View Mode
The following diagram shows the toolbar in story view mode.

| Key | Option |
|---|---|
| 1 | File |
| 2 | Edit |
| 3 | Tools |
| 4 | Display |
| 5 | Publish Data dropdown menu |
| 6 | Version Management |
| 7 | Allocate |
| 8 | Filter |
| 9 | Refresh |
| 10 | Bookmark |
| 11 | Page name |
| 12 | Page navigation |
| 13 | Fullscreen |
| 14 | Explorer View Mode toggle |
The following table shows the order of the toolbar options.
Options that have “planning models only” next to their names are only available if a planning model is added to your story.
| Menu/Functionality | Description/Submenu |
|---|---|
File (1) 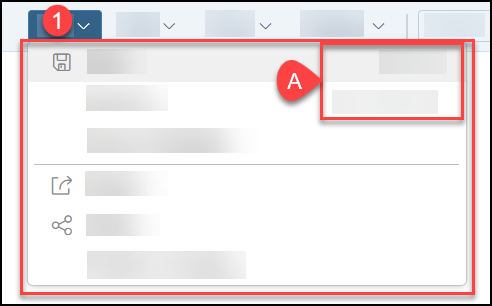 Note
The text on the right side of the dialog (A) show keyboard shortcuts for the Save and Save As options. For more information on keyboard shortcuts, see Keyboard Shortcuts for Story Pages. |
Save As Save As Template
Publish to Catalog |
Edit (2) 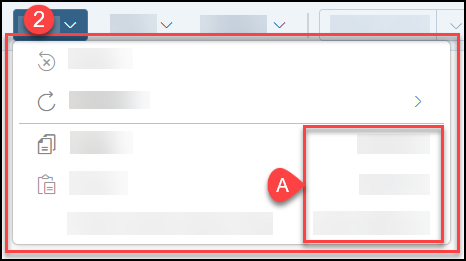 Note
The text on the right side of the dialog (A) show keyboard shortcuts for the Copy, Paste, and Paste Overall Values Only options. |
Refresh:
Paste Overall Values Only |
Tools (3) 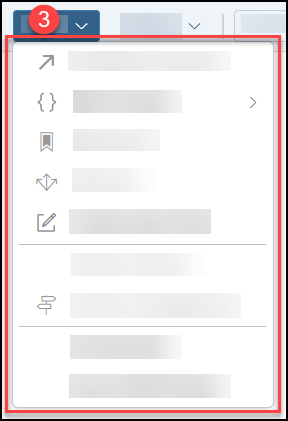 |
 Bookmark:
Version History (planning models only)
Formula Bar Story Filter/Prompt |
Display (4)  |
Tab Bar Comment Mode |
|
Publish Data dropdown menu (5) Note
If you are using a planning model in your story, this option is displayed in your toolbar. |
|
|
(Version Management) (6) Note
If you are using a planning model in your story, this option is displayed in your toolbar. |
|
|
(Allocate) (7) Note
If you are using a planning model in your story, this option is displayed in your toolbar. |
|
 (Filter)
(8) (Filter)
(8) |
|
| (Refresh)
(9) |
|
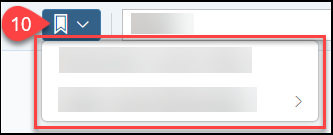 |
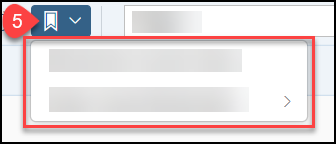
Bookmark Current State Open Saved Bookmarks |
|
Page name (11) |
This functionality shows the name of the current page. You can choose another page using the dropdown menu. |
|
Page navigation (12) |
This functionality shows the page number. You can use the arrows to navigate through the pages in your story. |
|
|
|
|
|


Toolbar Types: View Mode, Explorer View Mode
The following diagram shows the toolbar in Explorer view mode.

| Menu/Functionality | Description/Submenu |
|---|---|
File (1) 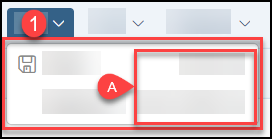 Note
The text on the right side of the dialog (A) show keyboard shortcuts for the Save and Save As options. |
Save:
|
Edit (2) 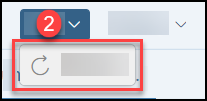 |
Refresh |
Display (3) 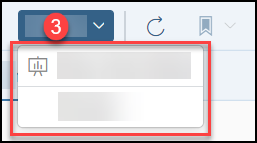 |
Tab Bar |
|
|
|
 |
Bookmark Current State Open Saved Bookmarks |
| Page name (6) | This functionality shows the name of the current page. You can choose another page using the dropdown menu. |
| Page navigation (7) | This functionality shows the page number. You can use the arrows to navigate through the pages in your story. |
 (Fullscreen)
(8) (Fullscreen)
(8) |
|
 Story View Mode toggle (9)
 |
Toolbar Options
You can find the following menu options on the toolbar that is directly above the story page. The options you see will vary depending on the way the story was created and the data that it contains.
| Functionality | Description |
|---|---|
| Save
|
a) Save As: save the story with a different name to create a new version of it. Keep in
mind that this copy is not linked or synchronized with the original one. b) Save As Template: save the story as a template that can be used to create a new story. c) Export: export the story as a PDF file or a Google Slides presentation. |
| Reset
|
Reset any changes that you made to filters and input controls to get the original view of the story. Your comments and any new versions of the story you created are saved. |
| Story Filter
|
Apply filters for all charts that are based on the same data source. The filter is applied in all the pages of a story. |
| Formula Bar
|
Calculate values in empty table rows and columns, or cells outside a table. |
| Refresh
|
a) Refresh: reload the story to get the most recent data. b) Auto Refresh: automatically refresh the story at an interval set by the story creator. |
| Edit Prompts
|
If this option is enabled, you can filter story data from the data source level by setting story variables that
you want to display in the story. Charts or tables that are built from that data source will get updated based on
the details you entered. For example, if you want the story to show only full-time employees who have worked in the company for at least 7 years, you can set these variables and change the details. |
| Comment Mode
|
Switch Comment Mode on and off to hide or display comments in the story. You can add comments to story pages as well as to charts and other objects in the story. After a comment is added, everyone who has access to the story will get notified. |
| Fullscreen
|
Display the story in full-screen, without toolbars. To switch out of full-screen view, hover at the top of the
page selector bar, and click  . . |
| Bookmark Current State
|
a) Bookmark Current State: create Personal bookmarks to save different states of a story as private bookmarks that are visible only to you. Story and page filters, input controls, prompts, explorer views, and variances are saved in your bookmarks. b) Open Saved Bookmarks: access your Personal bookmarks (created by you), Global bookmarks that are shared with anyone who has access to the story, and other bookmarks that are shared with you. When a Personal bookmark is shared with you, you have the option to remove it from your list of bookmarks.You can hover over a Personal bookmark to do the following:
|


 if
you no longer need it
if
you no longer need itAction Menu Options
Click anywhere within the area of a chart or table to open the Action Menu. Expand  (More Actions) to see all the options available in the
menu. Note that these options vary depending on how the table or chart was created and the data it contains. Just make a choice and
the selected chart or table will get updated right away.
(More Actions) to see all the options available in the
menu. Note that these options vary depending on how the table or chart was created and the data it contains. Just make a choice and
the selected chart or table will get updated right away.
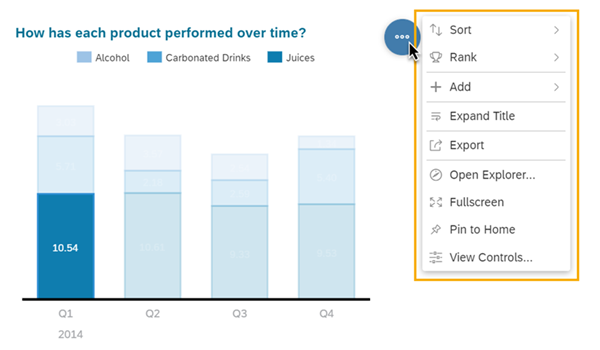
For more information on action menu options, see Chart Context Menu Options or Table Menu Options on Story Pages.
Context Menu Options
Click on a data point of a chart or table to open the Context Menu. Note that the menu options you get vary depending on how the chart or table was created and the data that it contains.
For more information on context menu options, see Chart Context Menu Options or Table Menu Options on Story Pages.
Additional Options
You can find more options on the story page, depending on the story that is being shared with you. Once you have made a choice, either the entire story page or selected elements on the story page will get updated accordingly.
| Functionality | Description |
|---|---|
| Pages
|
A story can contain multiple pages. Use the tabs to move from one page to the next. |
| Page Filter
|
If a story page contains page filters, you can filter all charts in the story page that are based on the same data source. |
| Input Control |
Input Control is one type of page filter. Select the data you want to display in your charts or tables and see the updates in real time. There are several display options you can choose from:
See the images below for some examples of input controls. |
| Linked Analysis | When multiples charts are connected to one chart through Linked Analysis, the charts will update simultaneously based on the selection you made in that chart. Once you are done, click a blank area within the chart to remove the filter. See the images below for more details on how to use and reset Linked Analysis. |
Input Control
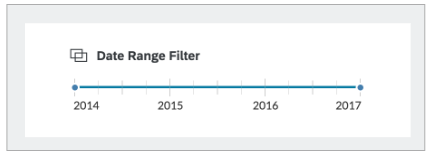
Slider
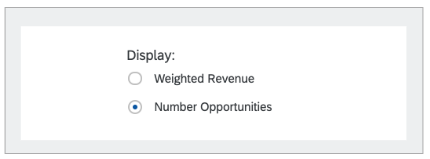
Radio Buttons
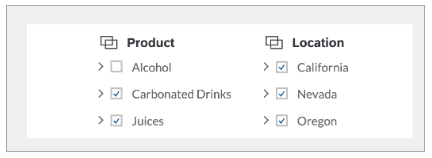
Checkboxes
Linked Analysis
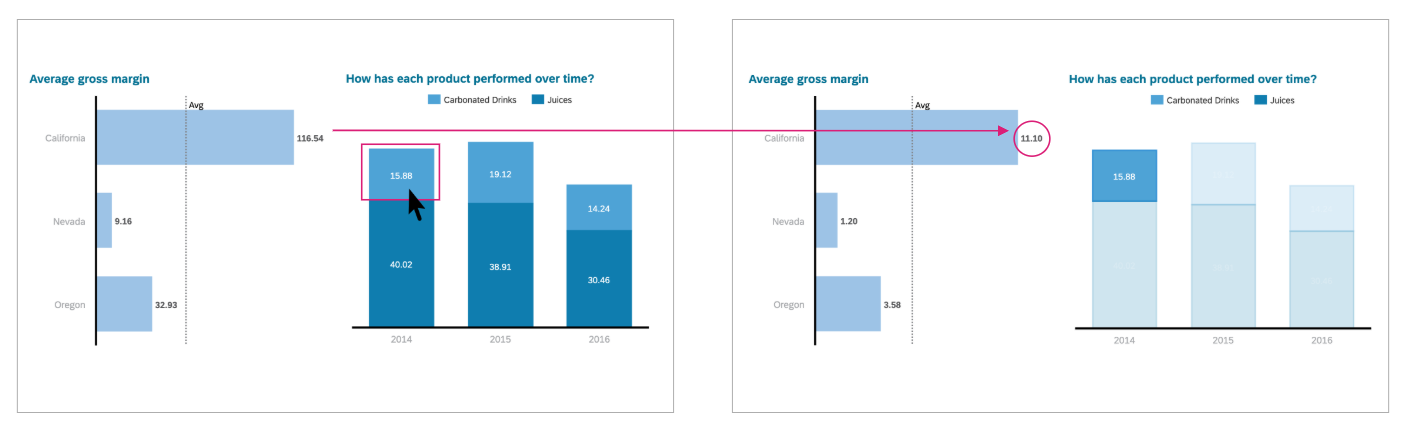
Using Linked Analysis
You can use a chart as a filter for other charts if they are connected through linked analysis.
Let's say you want to know the average gross margin of carbonated drinks in California 2014. Select the highlighted area on the vertical bar chart. Now, the numbers on the horizontal bar chart tell you the average gross margin of carbonated drinks in 2014, rather than of all products over time.
This is what it looks like before and after you use linked analysis on two bar charts that are linked together.
Resetting Linked Analysis
Here’s what it looks like before and after you reset linked analysis on two bar charts that are linked together.
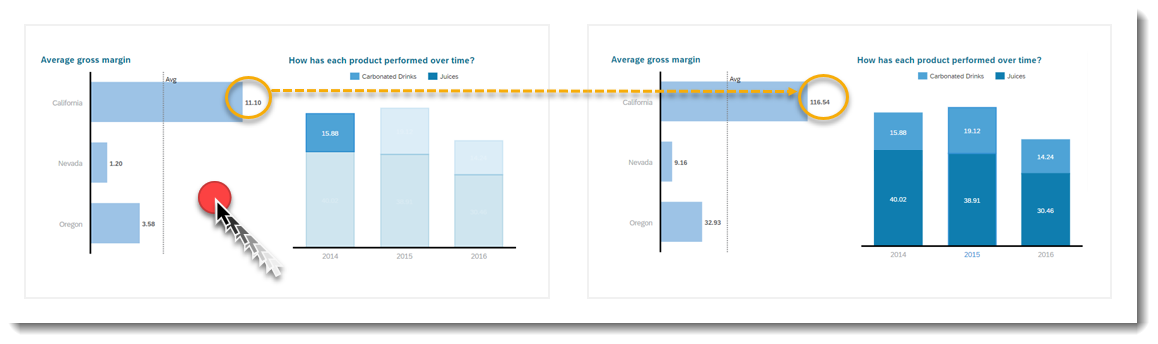
Do you want to reset your linked analysis? Just click on a blank space within your chart.
In the example above we applied a filter to see the average gross margin of carbonated drinks in 2014.
Do you want to remove the filter and see the margin of all products over time again? Simple. Just click a blank space within a chart and the chart is updated.