Best Practices for Performance Optimization in Your Story Design
These tips will help you discover ways to optimize the performance of your SAP Analytics Cloud story.
You want your SAP Analytics Cloud story to run smoothly, to have the best performance. The following tips will help optimize your story's performance.
Select a link to go directly to a tip.
Use Fewer Pages
When your story has a lot of pages, adding another page could decrease the story's performance.
For faster performance, you can create a new story or rearrange the story's content to use fewer pages.
If you are planning to rearrange the content, try to limit the number of data-related (process-heavy) widgets on a page.
Manage the Number of Process-Heavy Widgets on a Page
Story performance can be impacted when your story has a lot of widgets on a page, particularly data-related (process-heavy) widgets. For example, you have several charts, tables, or filters on a page. Processing data from those widgets can slow down the story's performance.
To determine the best performance for a story, the widgets are assigned a unit weight, with the maximum ideal weight per page set to 5 units.
The following tables show the unit weight per widget.
In Classic Story Experience:
| Widget | Unit Weight |
|---|---|
|
R Visualization (with at least 1 data frame) |
1.2 |
|
Geo Map |
1 |
|
Value Driver Tree |
1 |
|
Table |
0.6 |
|
Section on page |
0.5 |
|
Filter (expanded) |
0.4 |
|
Chart |
0.3 |
|
Dynamic Image |
0.3 |
|
Filters (non-expanded) |
0.2 |
|
Text (with Dynamic Text) |
0.2 |
|
Clock/Image/Shape |
0.1 |
|
Comment widget |
0.1 |
|
RSS Reader |
0.1 |
|
Text |
0.1 |
|
Web Page |
0.1 |
Additionally, in Optimized Story Experience:
| Widget | Unit Weight |
|---|---|
| Popup | 0.2 |
| Button/Checkbox Group/Dropdown/List Box/Radio Button Group/Range Slider/Slider/Switch | 0.1 |
| BPC Planning Sequence/Data Action Trigger/Multi Action Trigger | 0.1 |
|
Filter Line |
0.1 |
| Flow Layout Panel/Page Book/Panel/Tab Strip | 0.1 |
| Header | 0.1 |
| Input Field/Text Area | 0.1 |
Clock and Section on page are not available in Optimized Story Experience.
If you have a page that contains the following widgets, you will be close to the maximum weight and may start to see performance issues.
| Widgets | Weight | Total Weight |
|---|---|---|
| 2 Geo maps | 1 | 2 |
| 4 charts | 0.3 | 1.2 |
| 2 tables | 0.6 | 1.2 |
| Expanded filter | 0.4 | 0.4 |
| Grand total | 4.8 |
For faster performance, consider changing the types of widgets that you are using or reducing the number of heavy widgets per page.
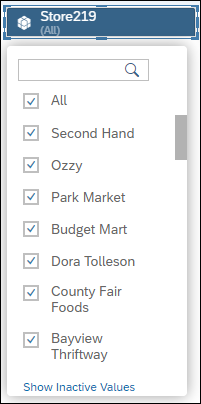
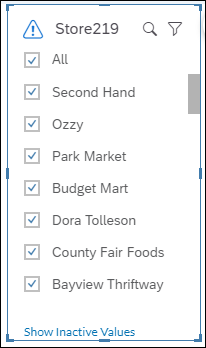
Collapse Page Filters and Input Controls
Expanded page filters or input controls are convenient because you can quickly select members or search for members in the control. However, an expanded input control refreshes often and that can affect the story's performance.
When the input control is collapsed, you must select the control to display the member list before you can search or make your selections.
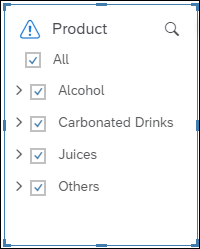
When you have a high cardinality dimension (a dimension that has 100 dimension members or more), leaving that dimension expanded can affect your story's performance.
Input controls for hierarchy dimensions can also affect the story's performance when expanded, even if they have fewer members.
Manually Set Top N
If you have high cardinality dimensions, consider manually setting the Top N values rather than using Auto Top N.
When Auto Top-N is used, all the data is transferred from the system before the Top N data is rendered. When you use Top N, the data is sorted and the Top N values are selected in the system. Only the Top N data is sent.
Keep Images Small
Whenever possible, upload background images that are 1Mb or smaller. Larger images take longer to load and will have an impact on your story's performance.
To get a good quality background image, you could use a compressed web image or you might want to use an SVG image instead of PNG, JPG, or BMP images.
Leverage header images, whenever possible.
Use Fiori Styles/Fonts instead of images.
Charts
To optimize charts, use the following guidelines:
-
Limit the number of charts on the page to enhance readability, decrease the number of backend requests, and improve performance.
-
Avoid charts with more than 500 data points.
-
Be aware of progressive chart rendering, which enables chart widgets to display more quickly when a story is opened a subsequent time.
-
Apply the Top N feature to charts.
Tables
To optimize tables, use the following guidelines:
-
Limit the number of tables on the page to enhance readability, decrease the number of backend requests, and improve performance.
-
Limit the number of cells in tables.
-
Apply the Top N feature to tables.
Geo Maps
To optimize geo maps, use the following guidelines:
-
Reduce the number of data points displayed on maps.
-
Enable location clustering for 1,000+ points, instead of the default of 5,000+ points.
-
Construct the layout of maps to limit zooming and panning if location clustering is enabled, as each movement submits a backend query.
Top Tips for Story Developers (Optimized Story Experience)
To significantly improve your story's performance at startup and save system resources, as a story developer, first consider the following four tips.
Load Invisible Widgets in Background
Loading and displaying visible widgets first before invisible ones makes the startup faster and thus increases your story’s performance. Invisible widgets aren’t only widgets set to be hidden in view time but also those inside invisible containers or on inactive tabs in tab strips, pages in page books and popups.
To do this, from Edit section in the toolbar, choose 
 (Refresh)
  Loading Optimization Settings
 . Then, select Background Loading.
For more detailed information, see Optimize Story Loading.
Pause Data Refresh in Widgets
You can pause the refresh of specific widgets in your story. For example, you can use setRefreshPaused API to pause the initial refresh of a chart or table until it’s updated by setDimensionFilter API in the onInitialization event. You can select Refresh Active Widgets Only from the Builder panel to pause the refresh of invisible widgets except when they are called by fetch data APIs.
For more detailed information, see Use Pause Refresh Options and APIs.
Enable Planning on Tables Only When Planning Is Used
You can deselect Planning Enabled from the Builder panel of a table using planning model if it isn’t used for planning at all. You can also leverage getPlanning().setEnabled API to enable planning in view time whenever it’s needed.
For more detailed information, see Use Planning Enabled Property and setEnabled API.
Use MemberInfo Object with setDimensionFilter() API
Use a MemberInfo object in setDimensionFilter() API, which contains member description in addition to member ID, so that there’s no roundtrip to the backend to fetch the member’s description.
For more detailed information, see Use MemberInfo Object in setDimensionFilter() API.