Work in the List Workspace
You can create, monitor, and manage your calendar events in the SAP Analytics Cloud calendar list workspace. This workspace displays your calendar events in a customizable table with a Gantt chart next to it, which you can push to the side or hide.
By default, your calendar opens in the List workspace displaying your events in a table with a Gantt chart next to it:
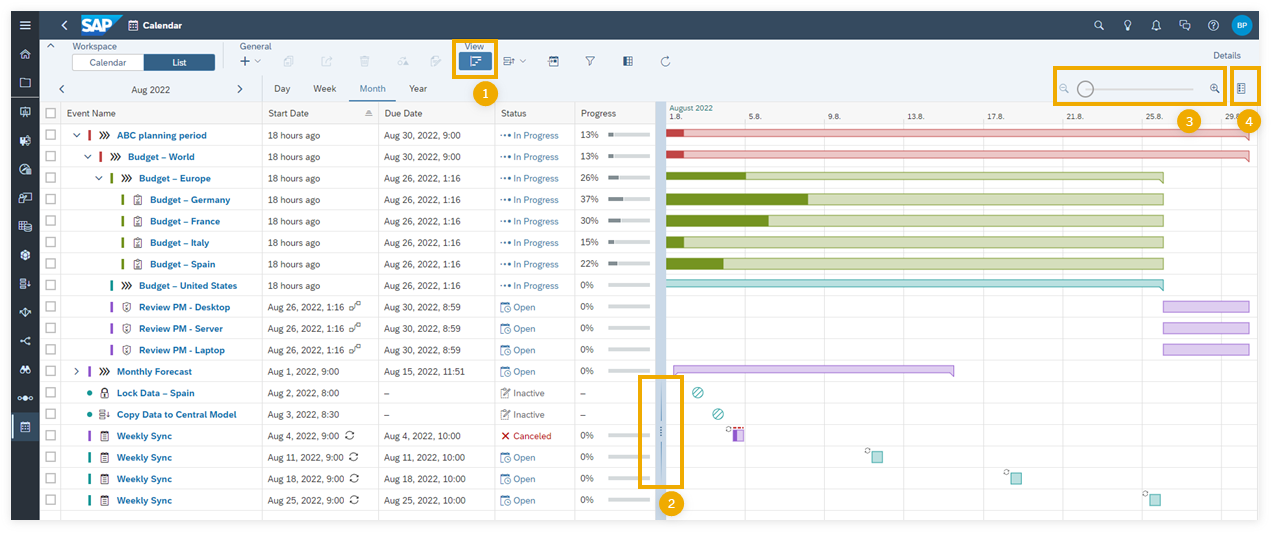
The calendar opens in the Calendar workspace if you worked there in your last session. You can go to the list workspace by selecting List from the Workspace menu.
Gantt Chart
 In the
View menu, you can show or hide the Gantt chart by
choosing
In the
View menu, you can show or hide the Gantt chart by
choosing  (Hide Gantt Chart) / (Show Gantt
Chart).
(Hide Gantt Chart) / (Show Gantt
Chart).
 To focus on the
table, you can drag the splitter to the right. To focus on the Gantt chart, you can
drag the splitter to the left.
To focus on the
table, you can drag the splitter to the right. To focus on the Gantt chart, you can
drag the splitter to the left.
 You can zoom in
or out in the selected time range.
You can zoom in
or out in the selected time range.
 To understand
the shapes and icons used in the Gantt chart, choose
To understand
the shapes and icons used in the Gantt chart, choose  (Show Legend).
Interacting between Table and Gantt Chart
You can expand or collapse parent processes by clicking the arrow in front of the event name. The Gantt chart is expanded or collapsed accordingly.
To work on a calendar event, click on its link in the Event Name column, or select the checkbox of the corresponding row and choose Details. The Details panel will be displayed.
Once the Details panel is open, you can open the details of another event by clicking on the respective event visualization in the Gantt chart.
Configuring the Table
Table Columns
-
Event Name
-
Start Date
-
Due Date
-
Duration
-
Status
-
Progress
-
Type
-
Style
-
Description
The first column of the list workspace is the Event Name column. This column is not customizable. If the style and type columns are not displayed in the list workspace, they appear as icons in front of the event names. A rectangle style icon indicates a manual event, whereas a round style icon represents an automatic event. Type icons change according to event type.
The date and time in the Start Date and Due Date columns appear either in a date format or as text. This depends on how close the start or due date is to the current date. Dates that are coming up or recently passed show up as text. For example, an event is shown as due in 2 days, whereas all other events appear in a date format (for example, the due date might appear as Jul 20, 2023, 07:00 PM). As soon as an event is finalized, the date and time appear in a date format.
The Progress column shows the progress in percentages. Once the event has been completed, the progress bar appears in green. Please note that automated events don't indicate progress.
Customizing
You can customize the table by selecting the columns that you want to display. To
do so, choose  (Select Columns) from the View
menu and select the desired columns.
(Select Columns) from the View
menu and select the desired columns.
You can adjust the size of the columns by dragging the double-headed arrow to the left or right. The arrow appears at the edges of the columns when hovering over it.
At the top of the table, you can change the List workspace to show the following time ranges: Day, Week, Month, or Year.
Sorting
You can sort your events in the list workspace by selecting  (Sort By) from the View menu.
You can sort according to the start and due time of your event, and choose whether you want to have the event displayed in an alphabetical order, or according to duration.
You can also sort your events directly in the columns. Select Sort Ascending or Sort Descending to sort by a specific column.
Filtering
You can apply filters to your events by selecting  (Filter) from the View menu.
You can filter according to Style, Status, My Roles, Due, Type, or Specific Events. Your filters are displayed in the filter bar next to (Add Filters). You can change or remove a filter directly from the filter bar. For more information, see Filter Calendar Events.
Working in the Gantt Chart
You can change the start date of an event by dragging the event around in the Gantt chart. To extend or shorten an event, you can drag the start or end lines of the event shape.
You can view dependencies among calendar events in the Gantt chart.
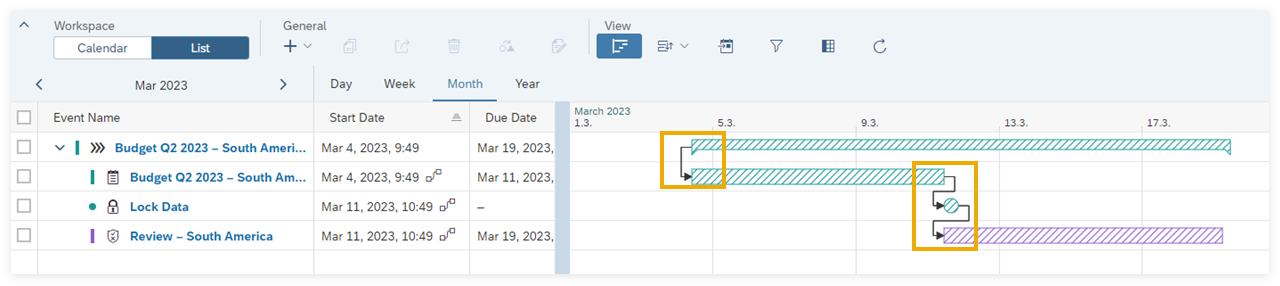
When you hover over a dependency line, it is displayed in bold. That way you can distinguish the lines when an event depends on multiple events.
You can also change the start conditions and the dependency definitions of the existing calendar events by creating or editing dependencies. For more information, see Changing the Dates and Start Conditions of Calendar Events.