Adding the Bubble Layer
You can add a bubble layer to a geo map.
Prerequisites
Procedure
-
To pick the model that the layer will be based on, under Data
Source, select
 (edit).
-
From the Location Dimension list, select the dimension
that you want to visualize.
-
To change the marker icon, select the arrow to the right of Style
and choose a new icon.
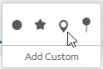 NoteYou can also use a custom marker; choose Add Custom, select Enter SVG Path to directly enter the icon's SVG Path, or select Upload SVG File to load the file containing the icon. If you are using a custom SVG, only the <path> attribute is read. All other attributes such as <transform> will be ignored - if your icon relies on these attributes it may not display as expected.
-
To change the marker icon, select the arrow to the right of Style
and choose a new icon.
-
Use the Add Measure/Dimension list under
Bubble Color to associate a bubble color with a
measure or a dimension.
NoteIf you are using a New Model with Measures as your data source, select + Add Dimension/Account to specify an Account and Measure pairing for the Bubble Color. To define more Bubble Color settings, expand the associated Account heading.You can choose the number of Ranges for the palette. This sets the number of KPI values and allows you to specify values to set the KPI ranges for each color in the palette. If necessary, adjust the Opacity of the bubbles to ensure that the basemap or other layers are visible.If you choose to associate Bubble Color with a dimension, the dimension's top five members are displayed within pie charts in the resulting bubbles. If no measure is specified for Bubble Size, the pie sections will be evenly proportional. If a measure is specified, the proportion will be aggregated according to the measure values. To highlight a bubble, select it once. To highlight a section of the pie within the bubble, select the bubble and then select the section. If you associate Bubble Color with a hierarchical dimension, you can drill up or down the hierarchy after selecting a bubble or section.NoteUse the switch beside the Ranges list to show KPI values as percentages or as absolute values. To reverse the palette order, use the
 (Switch) icon.NoteYou can only sync colors by dimension using a geo map and a chart.NoteYou can associate Bubble Color with only one dimension or measure. When working with New Models with Measures, you can associate Bubble Color with only one account and measure pairing.
 -
Use the Add Measure list under Bubble
Size to associate the bubble size with a measure.
NoteIf you are using a New Model with Measures as your data source, select + Add Account and + Add Measureto specify an account and measure pairing for the Bubble Size. To define more Bubble Size settings, expand the associated Account heading.
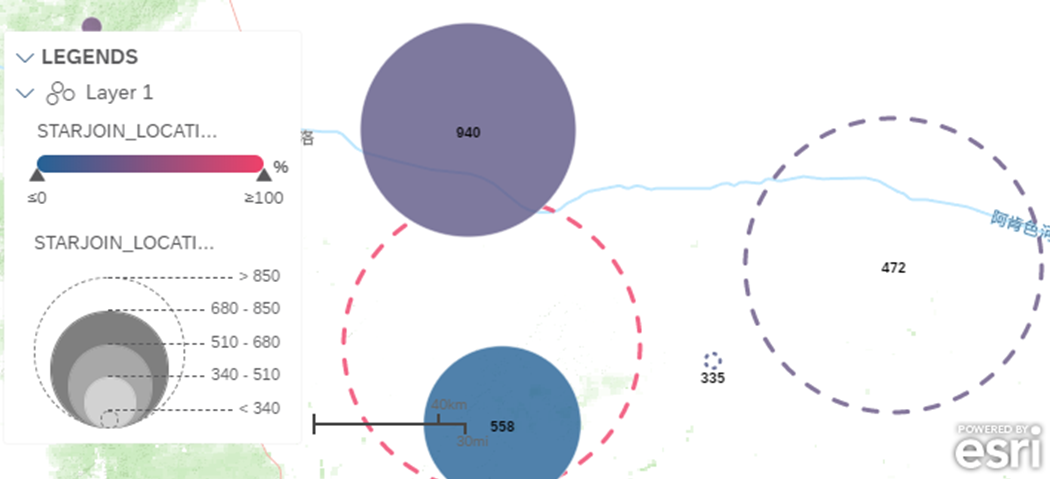
Use the Size slider to adjust the size of bubbles. Toggle the Adjust Range Scale switch between a scale range based on percentages and a range based on numeric values. You can customize the range by modifying the min and max values or using the provided range slider.
Data points representing values outside the bounds of the specified range will display as bubbles with dotted boundaries and no fill color.
-
To control the display of data point labels in geo maps, select the geo map and go to

 More Actions
 Show/Hide Labels
 ) to display or remove labels for a particular layer.
By default, labels will display in a Bubble layer, and labels will not overlap. However, to remove the automatic control on label overlap, choose Designer and select
 (Styling). Turn Off the
Avoid Data Label Overlap under
Labels.To visualize multiple data points associated with the same location, hover over the location to display all the values. The bubble size and color used for overlapping points is based on the average value of all the points at that location.
(Styling). Turn Off the
Avoid Data Label Overlap under
Labels.To visualize multiple data points associated with the same location, hover over the location to display all the values. The bubble size and color used for overlapping points is based on the average value of all the points at that location.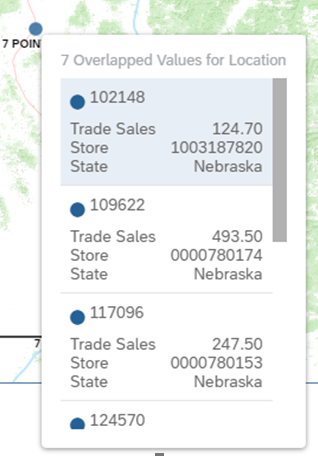
-
To display values for measures, you can go to More Actions Show/Hide Labels, select the corresponding layer, and under
Measures select the measure(s) for which you
want to display values.
-
To display values for measures, you can go to
-
To manage thresholds in the geo map, in
 (Builder) select the
  icon to the right of the
measure.
Go toShow Threshold None to remove all thresholds. Go to Show Threshold Model or Show Threshold Story to specify which type of threshold you want to display. Select
Edit Ranges or View all
Thresholds to modify the thresholds. If you choose not to
display thresholds in geo map, the Bubble Color palette
specified for the layer will override the one specified in the threshold. Any
palette changes will be reflected in the map legend.
icon to the right of the
measure.
Go toShow Threshold None to remove all thresholds. Go to Show Threshold Model or Show Threshold Story to specify which type of threshold you want to display. Select
Edit Ranges or View all
Thresholds to modify the thresholds. If you choose not to
display thresholds in geo map, the Bubble Color palette
specified for the layer will override the one specified in the threshold. Any
palette changes will be reflected in the map legend. -
To customize the data that displays for a given data point in the bubble layer, select the
 icon to right of Layout. You can also use the
(More Actions) icon to the right of the geo map to
access
icon to right of Layout. You can also use the
(More Actions) icon to the right of the geo map to
access  Add Tooltip or
  Add Tooltip Chart for a specific bubble layer.
- Select Tooltip Information to specify information displayed as
you hover over a given data point in the geo map. Use the provided
Tooltip Information field to choose from a
selection of measures, dimensions, and dimension attributes, or to create a
calculated measure or measure input controls. NoteIf you are using a New Model with Measures as your data source, you can choose from a selection of accounts, dimensions, and dimension attributes. Account information will only display in tooltips if a single measure is specified for Bubble Color and Bubble Size.
- Select Tooltip Chart to populate a corresponding table of information for a point in the geo map. Make your selections from the provided list of Measures and Dimensions, and click OK.
- Select Tooltip Information to specify information displayed as
you hover over a given data point in the geo map. Use the provided
Tooltip Information field to choose from a
selection of measures, dimensions, and dimension attributes, or to create a
calculated measure or measure input controls.