Modifying a Table
You can change the default design of a table in the SAP Analytics Cloud Builder panel as well as in the table itself.
The Builder panel allows you to modify different features related to your table, including changing the data source, adding data elements to rows and columns, creating filters, and so on.
You can also do some changes in the table itself, such as hiding data or rows and columns.
-
What can be done in the Builder panel.
-
What can be done in the table.
Builder Panel Overview
The following diagram displays the table Builder panel features available.
| Diagram | Legend |
|---|---|
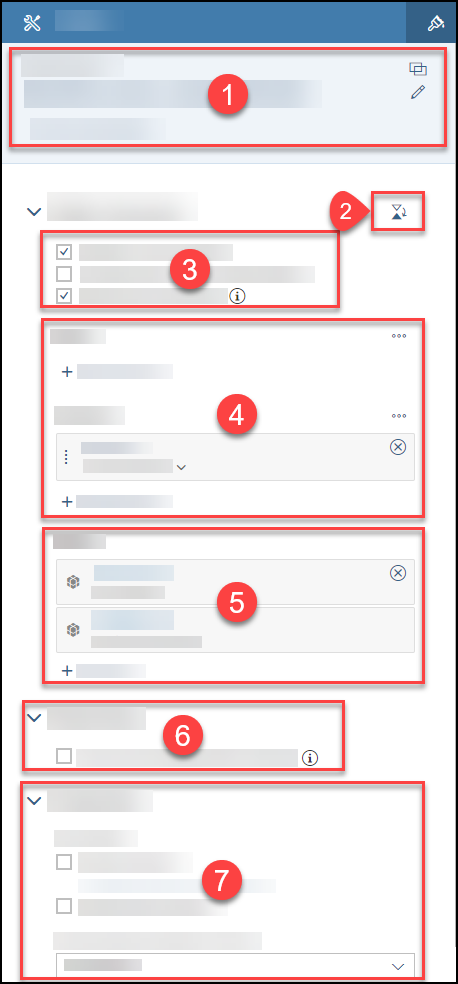 |
Builder Panel: Data Source
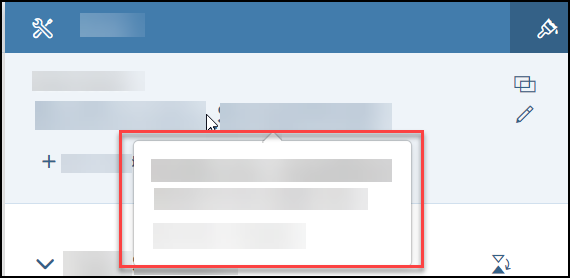
The data source is displayed in this area.
Hovering over or selecting the data source name will show a tooltip with the data source description and file path.
 (Refresh).
Builder Panel: Table Structure
Select  (Swap
Axis) to swap rows and columns.
(Swap
Axis) to swap rows and columns.
Table Properties
Cross-tab: For your planning model, you have two choices: a regular table (Cross-tab) or a forecast table (Forecast Layout). For more information, see Creating a Forecast or Rolling Forecast Layout.
Adaptive Column Width: Automatically resizes the columns when you resize the table. On a Responsive page, the columns can be aligned with columns of other tables in the same lane.
Arrange Totals / Parents Nodes Below: Moves totals to the bottom of the table. If you use a hierarchical model, when this option is selected, all child nodes will appear above the totals.
Forecast: Shows the cut-over date and how your planning model's data is summarized (Cut-over Year, Look ahead, and so on)..
Optimized Presentation: Provides fast-loading In-Cell charts, pixel-level resizing of columns or rows, and smooth scrolling. For more information on Optimized Presentation for tables, see Optimized Presentation Table: Features and Restrictions.
Rows and Columns
All dimensions and measures used to create the table are displayed in the rows and columns area. You can add more dimensions or measures to your table, or rearrange the ones you already have.
If a dimension has dimension attributes (also referred to as navigational attributes), you can expand the dimension in the builder panel and select the attributes. They will be added to your table just like other dimensions.
When you hover over a dimension, you can select  (Filter) to add or modify filters.
To make other modifications to the dimension, select  (More) and then select one of the following options:
 HierarchyFlat
presentation: Choose a different hierarchy to
display for the dimension. For example, you can choose to display different
periods for the Date dimension. You can also select to flatten the hierarchy of a dimension. (This
option is not valid for an Account dimension.)
HierarchyFlat
presentation: Choose a different hierarchy to
display for the dimension. For example, you can choose to display different
periods for the Date dimension. You can also select to flatten the hierarchy of a dimension. (This
option is not valid for an Account dimension.) To only show the leaf members of the hierarchy, turn on the Show only leaves in widget switch. For example, you can use this option while planning, if you want to enter data only at the leaf level of the dimension.
-
 Display Options: Show the member description, ID, or both the ID and description.Note
You can't change the display options for dimension attributes.
 Properties: Select multiple properties to display in the table, including ID and Description in
separate columns or rows.
Properties: Select multiple properties to display in the table, including ID and Description in
separate columns or rows.-
 Unbooked Data: Show or hide unbooked data. When unbooked data is hidden, only cells in the grid
that contain data are visible.Restriction
Unbooked Data: Show or hide unbooked data. When unbooked data is hidden, only cells in the grid
that contain data are visible.RestrictionAccount formulas will still appear if the operands of the formula contain data even though the Unbooked Data option is disabled.
When using SAP BW, unknown read modes received from the server can't be mapped to booked or unbooked data. To prevent unintended changes, the Unbooked Data setting is disabled in the Builder, and the read mode is used for the dimension.
When using an SAP BW data source, Unbooked Data is not available for unsupported read modes.
When you show unbooked data, the table is updated to include unbooked data for that dimension and any inner dimensions. A message appears stating that unbooked data has been switched on for dimensions below the selected dimension.
When you hide unbooked data, the table is updated to remove unbooked data from that dimension and any outer dimensions. A message appears stating that unbooked data has been switched off for dimensions above the selected dimension.
Above and below in the messages refers to how the dimensions are listed in the Builder panel.
-
Zero Suppression and Null Suppression: Show or hide zero and null values in a table.
For more details on zero or null suppression, see Hide zero or null values.
-
Show Totals: Show the sum of the dimension values.Note
For hierarchical dimensions, the total is added to the top-level node only. The total does not change when you drill into the hierarchy.
Create Top N will not change the total either, as it applies to all the data, not just the top values.
You won't be able to use the Show Totals option when you have calculated measures that contain if/then statements. For more information, see KBA 3015223
- Rename: Provide a customized description for a
dimension in your table rather than using the default value.RememberThe name you use for a dimension appears in the story, but does not change the name in the model.Note
If you use R scripts, they will not be automatically updated with the new name. You will need to manually change the dimension name in your script.
Builder Panel: Filters
All filters that have been applied to the table are
listed in the Filters section of the tab, and in the table subtitle. If the underlying model is using categories and periods in the
Date dimension, these are visible in the filters list and cannot be removed. Filters that have been manually applied can be removed by
choosing the  (Cancel) icon beside the filter and more
filters can be added here by selecting the Add Filters text at the bottom of the list.
(Cancel) icon beside the filter and more
filters can be added here by selecting the Add Filters text at the bottom of the list.
Filters are normally applied as restrictive filters (so that only the selected members are visible) but they can also be applied exclusively by selecting the Exclude selected members checkbox when you select the members; in this case, all members are included in the table except the selected items.
 (Set to
Invisible) next to the member. In the Selected
filters dialog, selected members are shown in two separate groups:
Selected members and Invisible
members. Invisible members do not appear in the table, but unlike
members that are filtered out of the table, their values are still aggregated to
parent members and can be affected when a parent member is adjusted.
(Set to
Invisible) next to the member. In the Selected
filters dialog, selected members are shown in two separate groups:
Selected members and Invisible
members. Invisible members do not appear in the table, but unlike
members that are filtered out of the table, their values are still aggregated to
parent members and can be affected when a parent member is adjusted. If you add a dimension that contains a large number of members, a filter to
restrict the number of members added to the table may be automatically
applied. You can manually remove an automatically generated filter using the
(Cancel) icon beside the
filter. You can also edit the filter and save modifications.
Filters for the Date Dimension
A number of options are available for applying filters on the Date dimension:
- Filter by member: this option is essentially the same as the standard filter with checkboxes to select or exclude individual members of the hierarchy.
-
Filter by range: using this option, you can define time periods based on years, half-years, quarters, months, weeks, or days (depending on the time granularity defined in the underlying model) and apply the date range as a filter, so that only details in the selected time period are visible. It is also possible to define multiple range time filters and apply these together. You could use this for example, to compare the first two months of the year over a three year period by defining three separate ranges for months Jan–Feb for each of the three years. When these ranges are applied as a single filter, everything else except the selected periods is filtered out.
Ranges can be fixed or dynamic; for example, you could choose the fixed range January 2017 to December 2017. If this story is opened in 2018, the story will still show 2017 data. For dynamic date ranges, in addition to the above granularities, these granularities are also available: current year, current quarter, and current month. For more information, see Story and Page Filters.
Builder Panel: Reporting
There is a Reporting section on your Builder panel if your table is on a canvas page. In this section, there is an option to Auto-size And Page Table Vertically. If you select this option, your table will expand or shrink automatically. If necessary, the application will split the table over multiple pages to fit the content.
For more information, see Using Pagination in Stories.
Builder Panel: Properties
View Mode
Enable Explorer (Classic Design Experience): Select whether to enable the Explorer to be launched directly from the tile when in view mode.
Explorer is not available when you use a data source that has multiple hierarchies in an account dimension.
If you want to restrict the number of measures and dimensions that are visible in the Explorer, select Configure Measures & Dimensions. Note that all measures and dimensions that are currently in the chart are automatically included and can’t be removed. Also, if you don’t specify any additional dimensions or measures, then only the ones used in the chart are available in the Explorer.
Enable Data Analyzer (Optimized Design Experience): Select to allow Data Analyzer to be opened from the table's action action menu.
For more information, see Data Analyzer.
Disable Interaction (Optimized Design Experience): Disables any interaction with the widget in view mode, such as filtering and showing tooltips. This option is available when you've enabled advanced mode ( ).
Data Refresh (Optimized Design Experience)
Choose a data refresh option to improve the efficiency of retrieving and update data on widgets after they are initially loaded in view time. The options are available when you've enabled advanced mode ( ).
-
Always Refresh (default)
- Refresh Active Widgets Only: Under this mode, you can avoid unnecessary data refresh. Visible widgets refresh, while data refresh for invisible widgets is automatically paused except when they're called by specific fetch data script APIs..
-
Always Pause: No data refresh takes place in view time, including initial loading.
For more information, refer to Use Pause Refresh Options and APIs.
Comments
Allow Data Point Comments: select whether to allow data point comments to be added on a table.
Planning enabled
Allows table cells to be edited. When not selected, the entire table is set to read-only.
Intersecting Calculations Priority
When you add calculated rows and columns to your table, you may have situations where the calculations intersect. The system can't resolve the calculation in the intersecting cell and displays a diagonal line instead of a value.
-
Unresolved: By default, no row or column priority is set. However, even when you choose a different priority you can change back to Unresolved at any time.
-
Columns Override Rows: Uses the calculated column value.
-
Rows Override Columns: Uses the calculated row value.
Boardroom
Select sorting options for when your story is used in the SAP Digital Boardroom.
Boardroom Keypad Slider
This option is available if you have the SAP Digital Boardroom add on.You can show or hide the keypad slider. Under slider options you can change the minimum value, maximum value, and step size.
Table: Hiding Rows and Columns
You can hide rows or columns of table data without filtering the table. However, hiding too many rows or columns can affect performance.
An information message appears when you choose to hide another row or column when you already have a combination of 80 hidden rows or columns.
To hide a row or column, right-click the column or row headers that you want to hide and choose
Hide row/Hide column.
You can select multiple members from within each dimension (for example, 2018 and 2019), and across different dimensions on the rows or columns (for example, Net Revenue for Laptops and Desktops).
The selected rows or columns are removed from the table view, but the data is not filtered out. The values of the remaining table cells are not affected, and any visible children of the selected members will remain in the table.
To add all hidden rows or columns back to the table, hover over Hidden beneath the table title and select . To restore individual rows or columns, select
Hidden and choose  next to a
member or combination of members.
next to a
member or combination of members.
Table: Showing Unbooked Data, Totals, or Properties
You can use the table to show unbooked data and totals (or visible properties), even when you don't have edit privileges.
 Show/Hide and then select one of the following:
 -
Unbooked
-
Totals
-
Properties: In the dialog, select the properties to show.
-
If you choose to hide (suppress) zero or null values while Unbooked Data is selected, the following message (or a similar one) is displayed.
“To apply Zero suppression, we're disabling unbooked data.”
-
Booked mode is disabled in View mode on the table context menu when you've selected to hide zero or null values. This applies to analytic models only.
Hide Zero or Booked Null Values
You can choose whether to hide zero or booked null values in a table.
Not all models use the same process for hiding zero or null values.
SAP Analytics Cloud acquired or planning models allow you to suppress zero or null values in both view and edit mode, but models from SAP BW, SAP HANA live, and other data sources may only suppress these values when using the Builder panel to edit the table's structure.
Acquired Models: Hide Zero or Null Values using the Builder Panel
You can suppress zero or null values for all dimensions and measures in rows or columns.
-
In your story, select Edit and Designer.
-
Select your table.
-
In the Builder panel, for either the Rows or Columns heading, select
(More), and then select one of the
following options:
-
Zero Suppression
-
Null Suppression
-
If you choose to hide (suppress) zero or null values while Unbooked Data is selected, the following message (or a similar one) is displayed.
-
“To apply Zero suppression, we're disabling unbooked data.”
-
“To apply Null suppression, we're disabling unbooked data.”
Acquired Models: Hide Zero or Null Values Using a Table
The default behavior is to show zero values and hide (suppress) null values.
 (More)
  Show/Hide
 , and then select one or more of the following:
 -
Zeros in Table Rows
-
Zeros in Table Columns
-
Nulls in Table Rows
-
Nulls in Table Columns
If you select Unbooked Data while zero or null suppression is selected, the following message (or a similar one) is displayed.
“To apply unbooked data, we're disabling zero suppression.”
SAP BW or HANA Models: Hide Zero or Null Values
For SAP BW or SAP HANA models, you can only show or hide zero and null values when editing the table, not viewing it.
However, there are some differences in behavior depending on whether you're working with SAP BW or SAP HANA.
| SAP BW | SAP HANA (analytic models) |
|---|---|
| Hide zero and null values on either rows or columns, or both simultaneously. | Hide zero or null values on all rows and columns. |
| Hide zero and null values on all cells, or on totals. | Hide zero or null values on cells. Rows or columns are removed if all cells along the row or column are zero or null. |
SAP HANA Live Models
-
In your story, select Edit and Designer.
-
Select your table.
-
In the Builder panel, select a dimension, select (More), and then
select one of the following options:
-
Zero Suppression
-
Null Suppression
-
SAP BW Models
SAP BW models don't have separate options for zero and null values.
-
In your story, select Edit and Designer.
-
Select your table.
-
In the Builder panel, select a dimension, select
(More) Zero Suppression, and then select one of the following options:-
All Cells
-
Totals
-
- Specific to SAP BW:
The Zero Suppression selection applied to a row persists, even if you drag and drop that row to the column area in the Builder. Similarly, switching off the Zero Suppression option in the column area doesn't switch it off in the row area.