Learn About the Modeler
The Modeler is where you view, edit, and configure models.
- Model Structure screen
- Calculations screen
- Data Management screen
- Dimension grid view
- Using Modeler features
Model Structure
There are three areas in the Modeler: Model Structure, Calculations and Data Management. When you open an existing model, its contents are shown on the Model Structure screen composed of the dimensions list (1), the structure view (2), the data foundation view (3), and the Model Details pane (4).
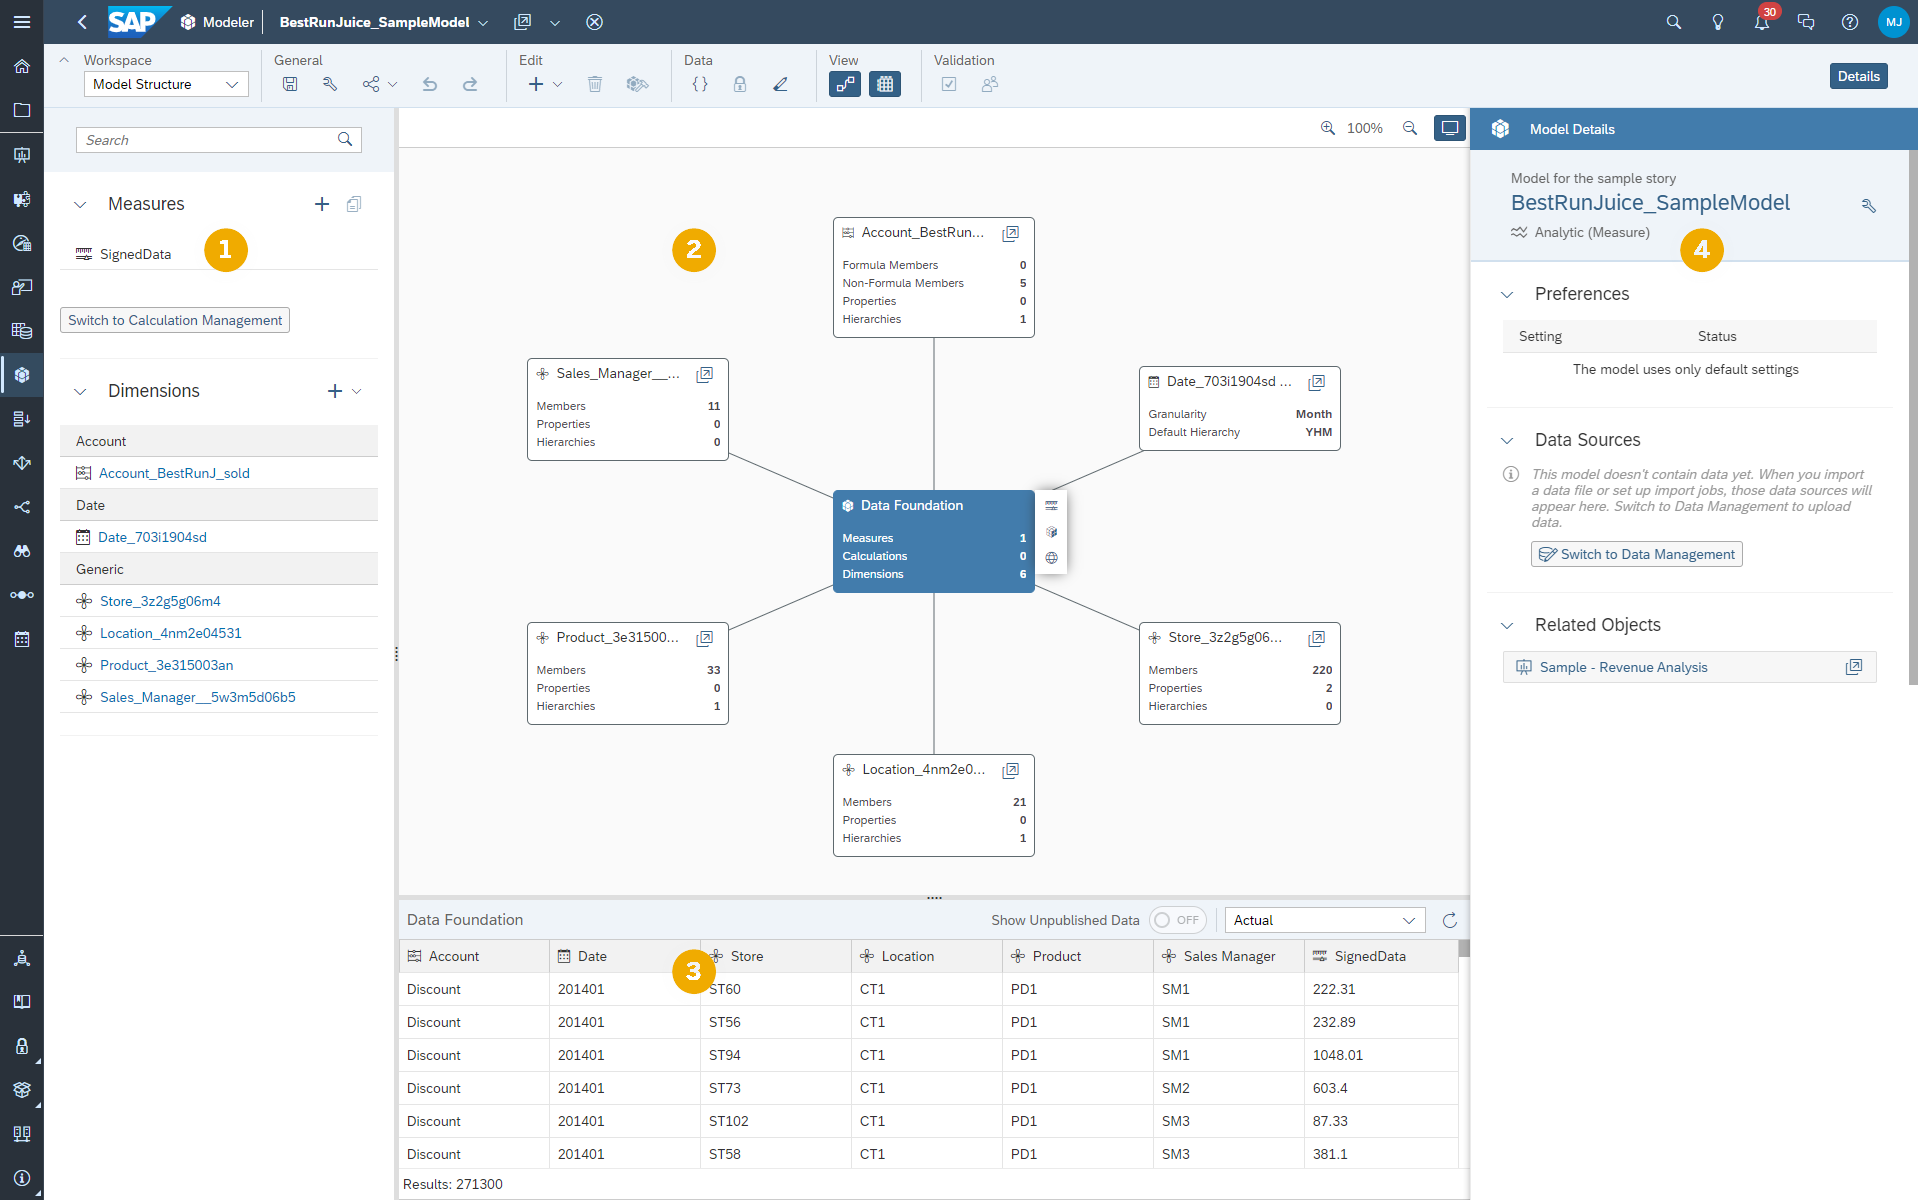
The Model Structure screen contents can vary depending on the model type. If you're working with a traditional account model, it shows you the dimensions of the model. If you're working with the new model type, it shows you both dimensions and measures. As standard, for both model types, it also shows you the number of members and hierarchies in each dimension, and any attributes that have been defined for the dimensions. On the right, the Model Details pane shows you the model settings, data sources, and other information about the model.
The Structure view shows you a star schema diagram that represents the contents of your model. It helps visualizing how fact data, attributes, and properties all relate to each other.
The Data Foundation view helps you understand the data you have access to. Depending on your user settings and rights, the data you see might differ from another user.
The data you can see in the data foundation view and the number of results is filtered based on the data access control and security settings, as well as active filters within the table. You can also select the version you want to display, including private versions, using the dedicated dropdown menu. By default, the results you can see in the data foundation don't include unpublished data, and only display public data. However, if needed, you can toggle on the Show Unpublished Data option to show unpublished data and update number of results, as well as the data visible within the table.
The data foundation view supports up to 100 millions published facts. Above that limit, a message is displayed to let you know that the data cannot be previewed. As a workaround, try adding the model data to a story to view the whole dataset.
For more information about the Structure and Data Foundation
views, see https://blogs.sap.com/2020/04/24/were-improving-modeling-in-sap-analytics-cloud/ .
.
When you select a dimension or a measure, the view changes to display the Dimension Settings or Measure Details pane on the right with and detailed information about the selection:
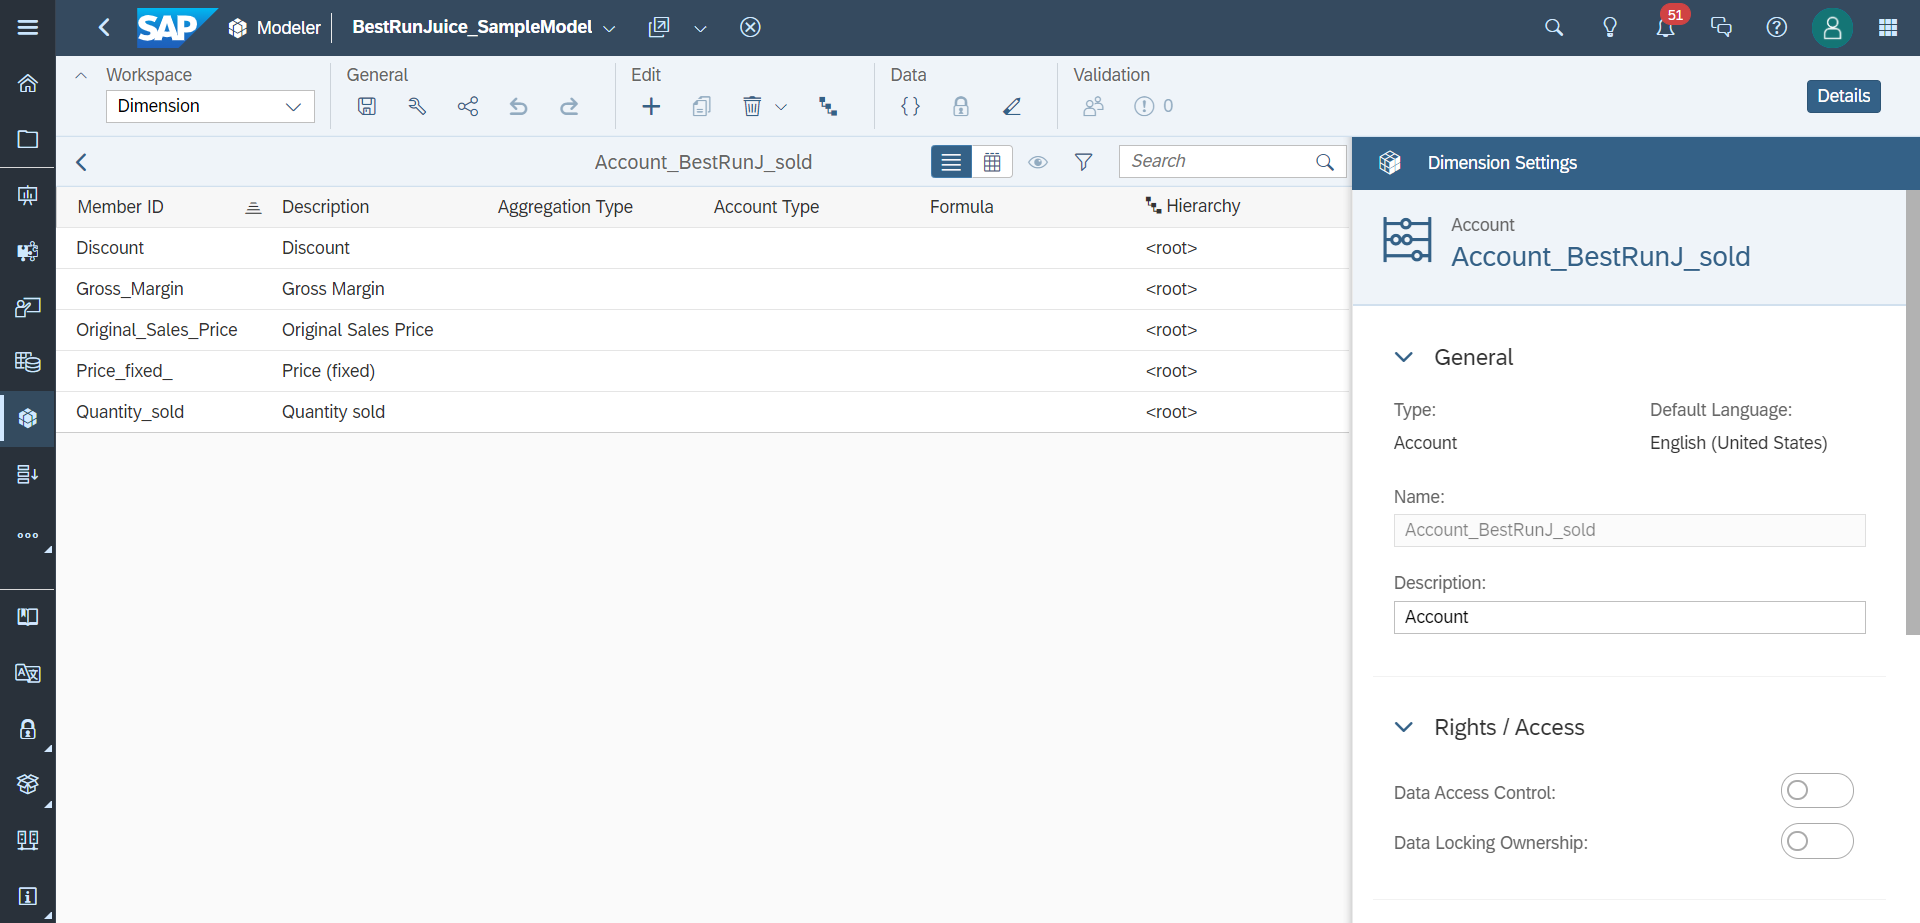
You can switch between the list view, where dimension members and their properties are shown in a non-editable list, or the grid view, where you can make changes to the dimension's values and properties:

The Dimension Settings and Measure Details pane display information about the selected dimension or measure, and let you define hierarchies, create calculations, and change properties and settings.
In the list view, when selecting a dimension member, the application switches to the Member Details pane, where you'll find information about the member you've selected. You can switch back and forth between Dimension Settings and Member Details with the dedicated toggle:

Calculations
The Calculations screen is where you can create additional calculations for your model.
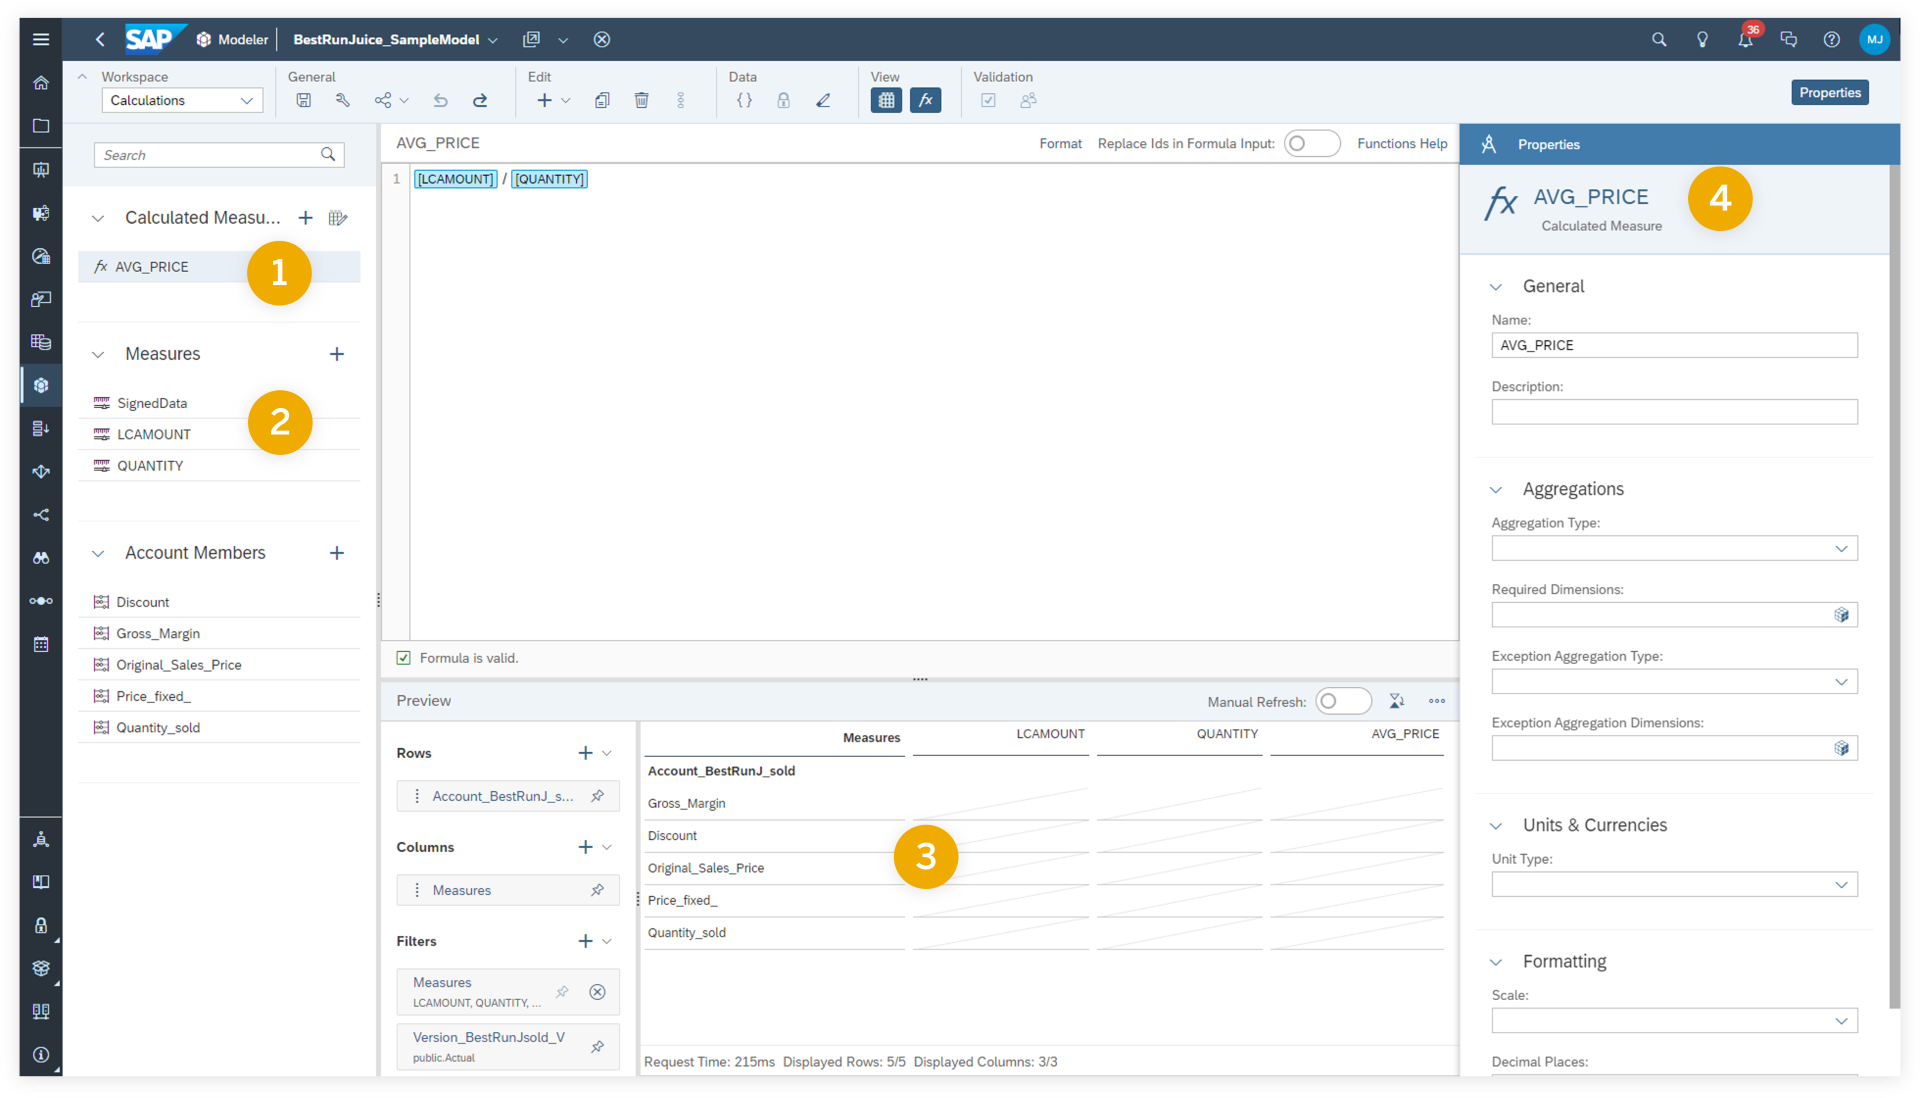
It's composed of the of the objects list (1), the formula editor (2), the preview pane (3), and the properties pane (4).
The objects list can vary depending on the model type. If you're working with a traditional account model, it shows you the dimensions and account members of the model. If you're working with the new model type, it shows you both dimensions and measures, as well as account members, calculated measures and conversion measures if there are any in the model.
With the new model type, you can create calculations on existing accounts and measures by clicking the + icon next to the Calculated Measures, Conversion Measures and Account Members labels to open the central pane with the formula editor up top, and the Properties pane on the right.
The formula editor lets you create formulas and calculations using a combination of business functions, other objects, formulas functions, conditions, and mathematical operators. If you need help when writing formulas, use the Functions Help button to open the embedded documentation, or hit Ctrl + Space or Cmd + Space to get detailed information on the available formulas.
The calculations preview pane lets you see your aggregated and calculated data within the Modeler before moving on to a story. It takes all the structure information coming for the Model Structure screen to create a preview, and provides you with realtime calculations results without having to save the measures and accounts first.
If you add calculated measures, measures, accounts or conversion measures to the model, the preview gets updated and you can see how calculated data impact the model by adding objects used in the calculations in the preview table to see how the calculated values are derived.
However, the preview table changes automatically depending on your selection in the left panel, which resets the table configuration. You can freeze the table configuration by pinning rows, columns or filters by clicking the pin icon so that they’re always visible regardless of the member selected in the left panel.
You can organize the preview table and move rows, columns and filters around using drag and drop and rearrange them to preview data as you see fit, just like you would in a story. You can also switch axes by clicking .
The properties pane give you information about the selected object in the objects list.
Hierarchical Filters
In the Preview panel, you can decide whether you want to have dimension members displayed in a flat list, or hierarchically using hierarchical filters. Hierarchical filters are filters for which you can select a hierarchy available in the dimension. You can switch hierarchies depending on the way you want to display the results, just like you would in a story. With these filters, you can see all dimension members and their booked values.
Also, for account dimensions, when a measure is selected, there’s no longer need to have default filters defined. By default, the application displays all members hierarchically.
You can select a hierarchy either by clicking a filter in the Filters section, or by clicking and Select Hierarchy next to a dimension in the Rows or Columns section.
For account dimensions, there are two ways to filter. If you select a measure and try to filter on an account member, the application displays a hierarchical list, and you can select the hierarchy you want to show. In that case, you can see all account members. However, if you select an account member first, you can select between Used Members and Other Members. That’s useful if you only want to check the account members that are used, in formulas for instance, or simply to check the member info.Data Management
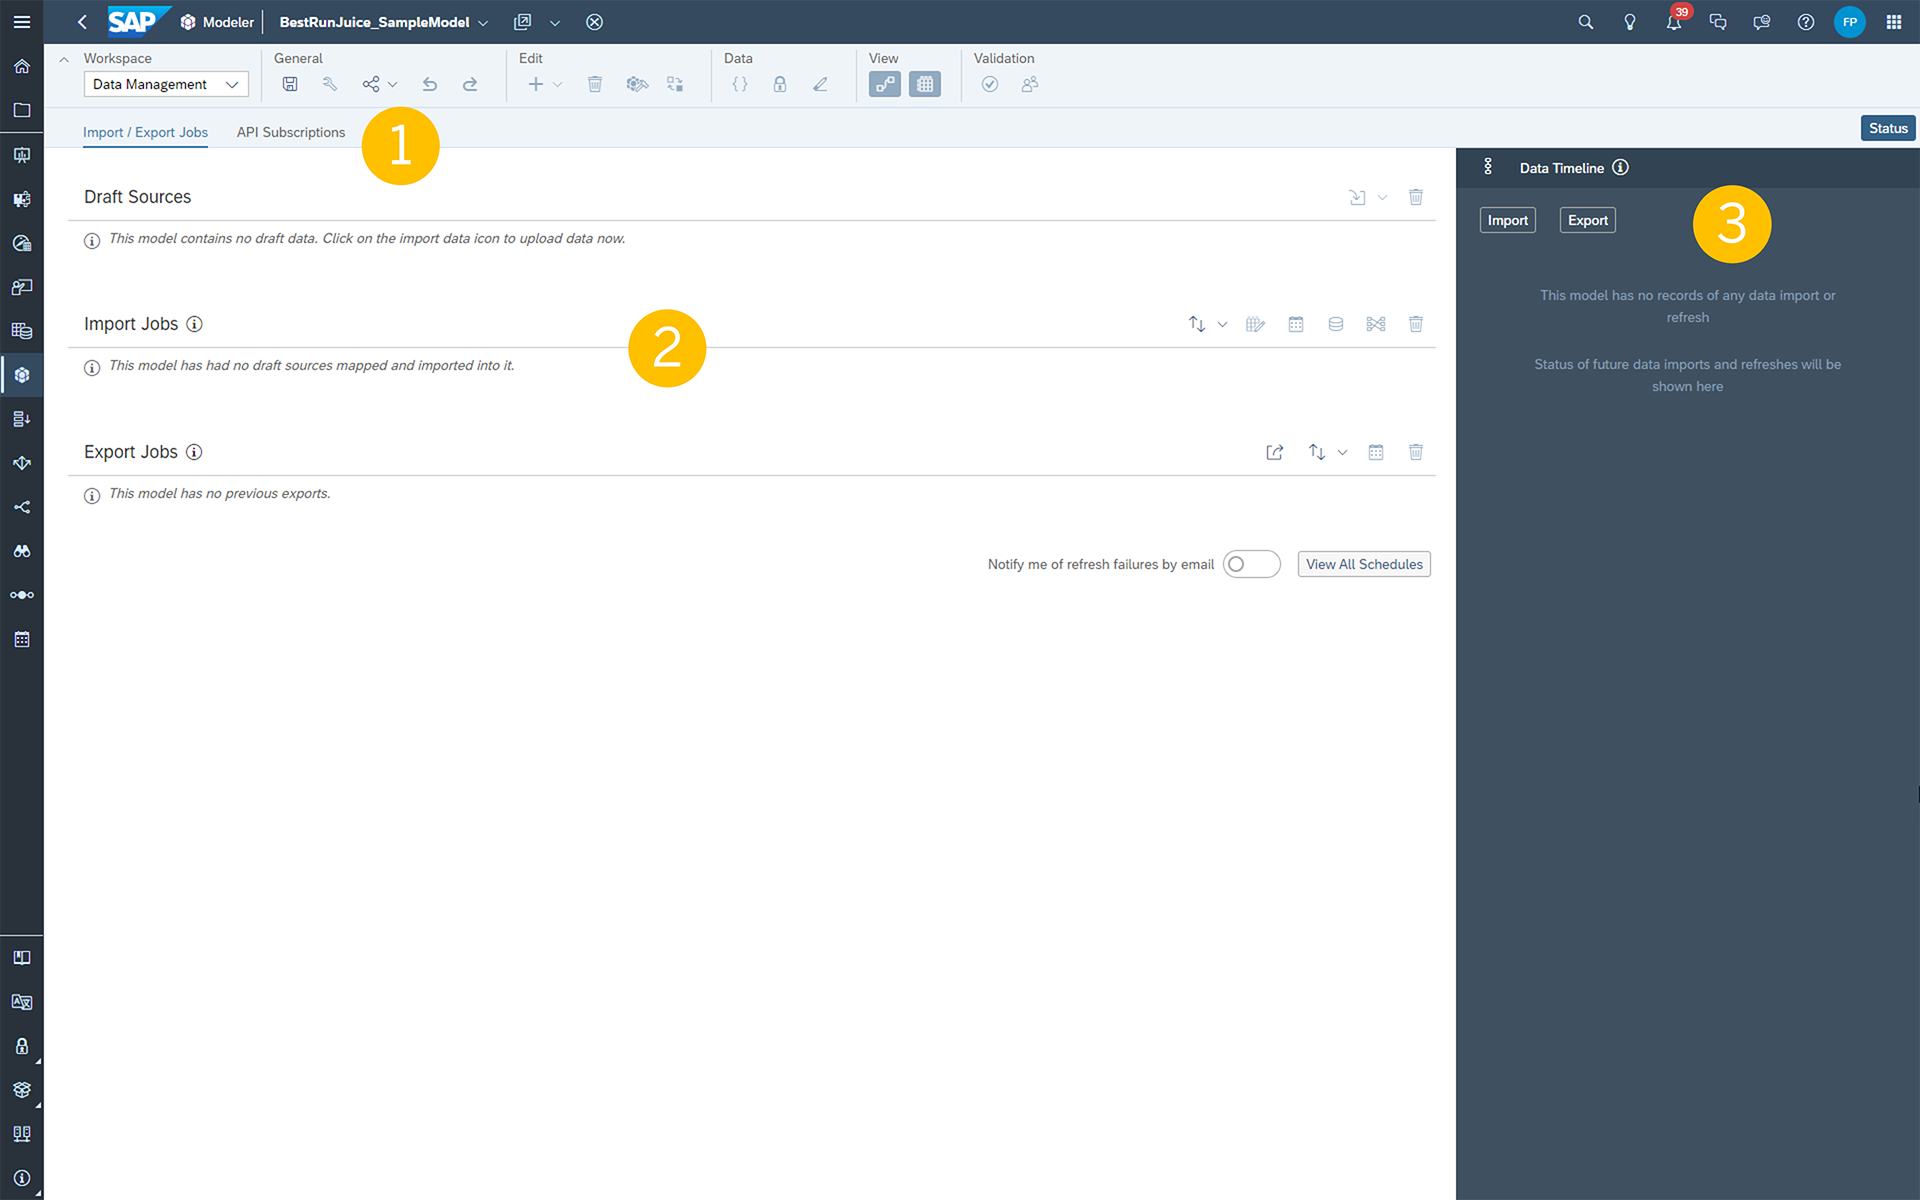
When you create a new model, the Data Management screen appears. The Data Management screen is the place where you can import and export model data, but also schedule data refreshes for specific data sources and dimensions.
As a best practice, instead of having to rely on
individual query names, try naming scheduled jobs to describe an entire job. To edit
the name of a data refresh job, select  (edit) next to the job's name. For more information about
refreshing data in models, see Update and Schedule Models.
(edit) next to the job's name. For more information about
refreshing data in models, see Update and Schedule Models.
The Data Management screen composed of two main tabs: Import / Export Jobs, and API Subscriptions (1).
The Import / Export Jobs tab lists all draft sources, imports and exports to specific data sources (2).
The API Subcriptions tab lets you view and manage your data export service subscriptions, the preferred way of exporting models and their associated metadata. API subscriptions can be managed directly within the Modeler. For more information, see Manage API Subscriptions for Data Exports. For detailed information on the delta functionality, check out the Data Export Service documentation.
In both tabs, a data timeline (3) displayed on the right provides a history of the data changes, import, export and refresh jobs depending on the data source or subscription you select. It also indicates whether a job has run smoothly or if it has been rejected.
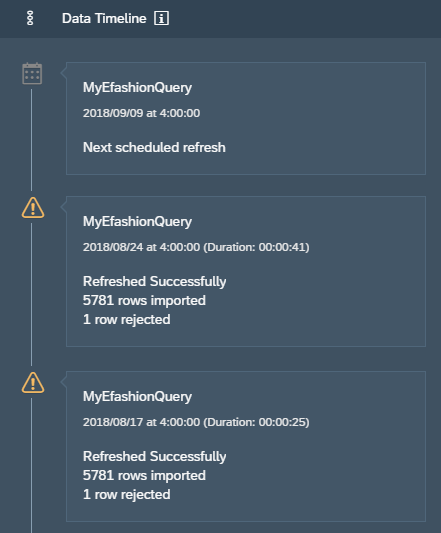
- Imported Successfully: the data was imported with no errors.
- Next scheduled refresh: the next time a scheduled refresh will occur.
- Refreshing: the refresh job is in progress.
- Refresh failed: the refresh job failed and no data was imported.
- Refreshed Successfully (Download Rejected): the source was refreshed partially but some rows were rejected.
- Refreshed Successfully: the source was refreshed successfully.
Import / Export Jobs
The Import / Export Jobs tab is divided in three sections.
Draft sources
The draft data sources correspond to data has been uploaded to SAP Analytics Cloud, but hasn't been saved to a model yet.
Import Jobs
Import jobs are connections between your model and a data source that you imported data from. In some cases, for example if you import data from a file on your local computer, the import job just provides information about the data import. But in many other cases, the import job can be re-run, and scheduled, so that you can re-upload data periodically from that same data source to your model. For more information, see Update and Schedule Models.
You can also view an import job's data mapping and transform history after importing data into a public model or public dimension, so that you know how to map or transform data if you want to create another import job for that model or dimension.
Export Jobs
Export jobs allow you to reuse model data in other systems such as SAP S4/HANA or SAP Business Integrated Planning. By default however, only the file and SAP BPC options are available. To be able to export to other systems like SAP S4/HANA, SAP Business Integrated Planning, or SAP BW and BW4/HANA using OData services, make sure to enable the Enable Legacy Export option first under the Data and Performance tab in the model preferences.
API Subscriptions
The API Subscriptions tab lists the Data Export Service subscriptions, which correspond to the delta changes in a given planning model.
Here, you can create, track, and manage delta subscriptions for a given model, but also generate delta links that you can reuse elsewhere if needed. The list displayed corresponds to a subscription chain, but clicking the View Details options takes you to a detailed list of individual subscriptions of a chain.
In the Subscription Details dialog, you can find the export history of the subscription, and copy delta links for future reuse. For more information on how to manage subscriptions in the Modeler, see Manage API Subscriptions for Data Exports.
At the bottom of the list, the View All Subscriptions button takes you to the Subscriptions Overview tab on the Connections page. Here, administrators with the BI Admin and Admin roles and Create and Delete permissions for connections can view all subscriptions for any model available on the SAP Analytics Cloud tenant and access further information using the View Details option. Note that isn’t possible to delete subscriptions from the Subscriptions Overview tab in the Connections page.
Dimension grid view
When switching to the grid view, the dimension's contents are shown in an editable grid:
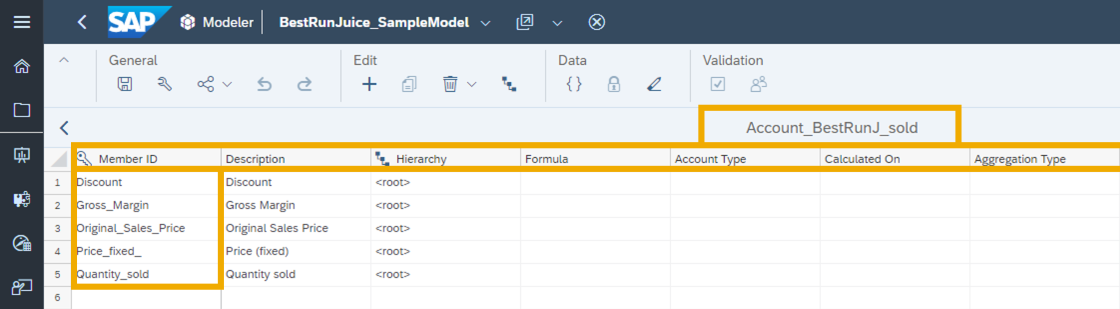
The data objects shown in the grid are:
- Dimension name.
- Dimension attributes and properties: Member ID, Description, and so on.
- Dimension members: Discount, Gross_Margin, and so on.
Using Modeler features
These are some of the helpful features available in the Modeler:
- Filter a dimension: When you select a dimension to view the dimension details,
you can filter out members that you're not interested in.
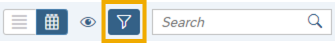
- First, select the Filter button in the toolbar:
- Next, select
 (Add
Filter).
(Add
Filter). - Choose a dimension property or hierarchy to filter.
- Type your filter text, and select Add Filter.
- Repeat steps 2-4 to add more filters.
Note: filtering doesn't apply to data that hasn't yet loaded from the server due to pagination.
- First, select the Filter button in the toolbar:
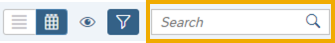
- Search for members: Type a search string to find dimension members:
Custom properties: You can add custom properties (columns) to dimensions. Click the Create Property button in the Dimension Settings panel.
Column menu: This menu appears when you select a column header.
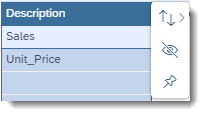
 : Sort the
column.
: Sort the
column.Note: sorting doesn't apply to data that hasn't yet loaded from the server due to pagination.
 : Hide the
column. You can also select Show Columns to
show or hide any columns:
: Hide the
column. You can also select Show Columns to
show or hide any columns: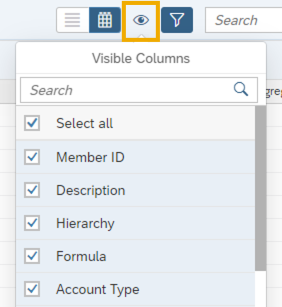
 : Pin the column.
Pinned columns stay displayed at the left side of the grid when you
scroll to the right. To unpin a column, select the icon again, or drag
the column out of the pinned area.
: Pin the column.
Pinned columns stay displayed at the left side of the grid when you
scroll to the right. To unpin a column, select the icon again, or drag
the column out of the pinned area.
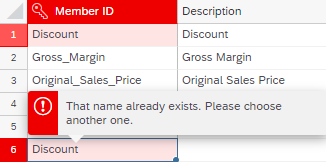
Data validation and error highlighting: As you work, the model is continually scanned for data irregularities. Any errors are reported by the Validation icon in the toolbar:
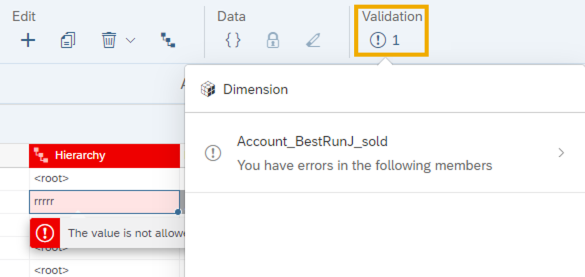
When grid cells contain errors, you can also select the cell for more information:
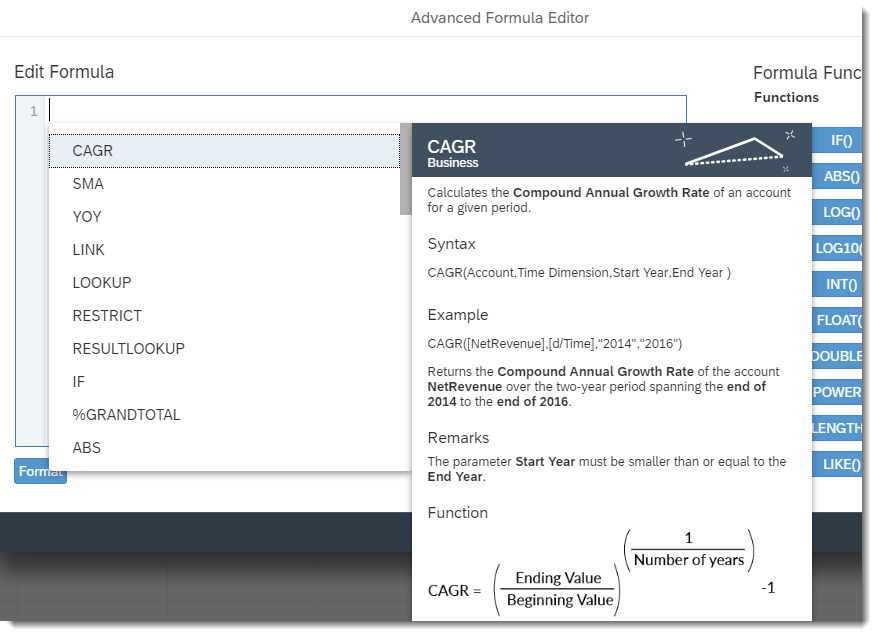
Add a formula: In the Formula column, select the icon to open the Advanced Formula Editor.
Press Ctrl + Space to see the available formulas, and then highlight a formula in the list to see a detailed description of the formula:
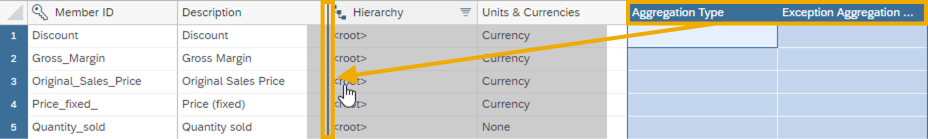
Moving columns: You can rearrange columns in the grid by dragging their headers.
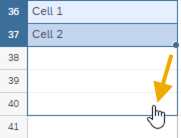
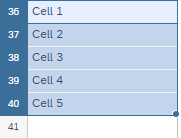
Context-sensitive copy: If you have cells containing the values Cell1 and Cell2, when you select both cells and copy to the cells below, the cells will be populated with the values Cell3, Cell4, and so on.
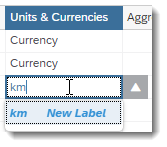
Account labels: For account dimensions, you can type custom labels for the Units & Currencies column:
-
Keyboard navigation: You can use these keys while working in the grid:
Keys Action Space Opens a cell for editing (same as double-clicking a cell) Enter Move down 1 cell Shift + Enter Move up 1 cell Tab Move right 1 cell Shift + Tab Move left 1 cell Page Down Move down 1 page Page Up Move up 1 page Alt + Page Down Move right 1 page Alt + Page Up Move left 1 page Ctrl + Shift + Space Select all Space, t, and f In columns with check boxes, for example the Hide column, the Space key toggles the check box, while t (true) selects it, and f (false) deselects it.