Create a New Story (Optimized Story Experience)
SAP Analytics Cloud stories combine your data with visual elements that help you to describe and analyze your data.
Context
A story is a document that uses charts, visualizations, images, and other objects to describe and analyze data. You can share your stories with other users and grant permissions for these stories. When you share your stories, users with view permissions can analyze the data by navigating within the stories.
Learning Tutorial - Basic Story
Click through the interactive tutorial illustrating how to create a story in the optimize story experience in step-by-step instructions (4:00 min); the tutorial is captioned exclusively in English:
Follow these steps to create a basic story.
Procedure
-
From the side navigation, select
 Stories.
-
Select Optimized Design Experience, and then select Create.
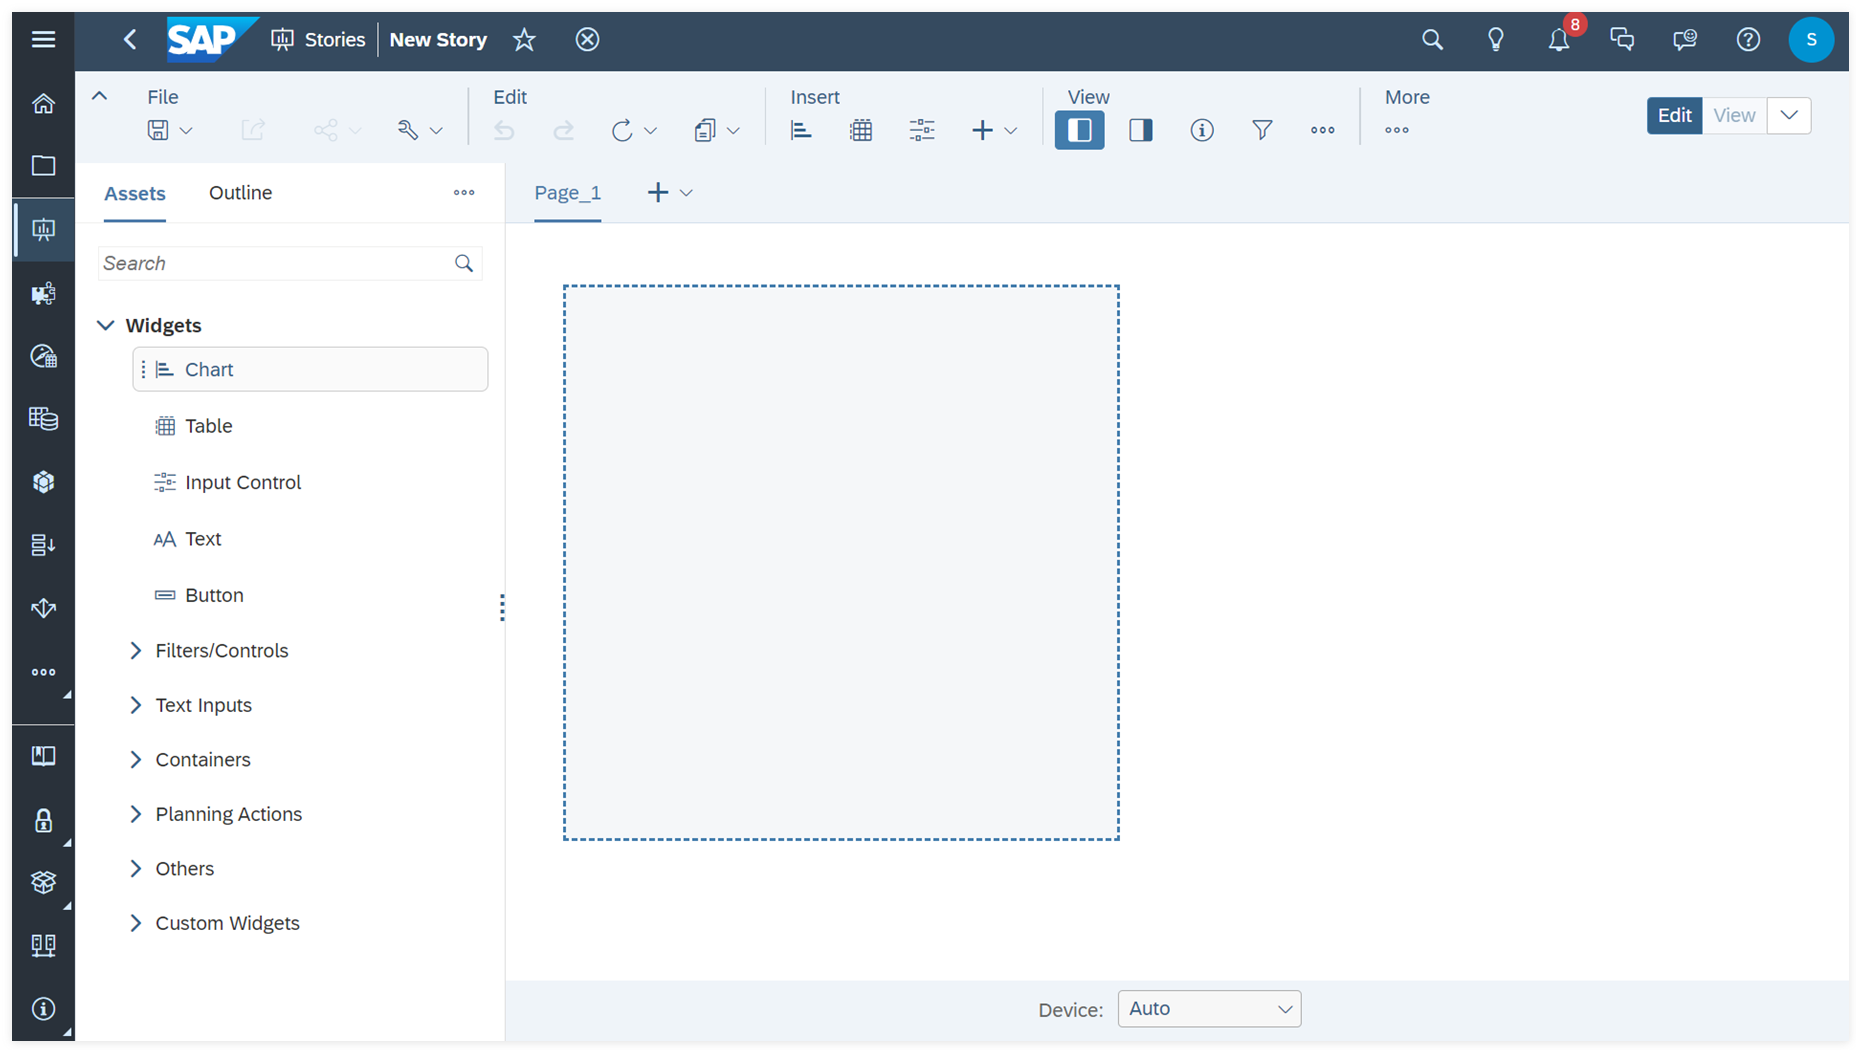
The story opens with the Assets panel displayed on the left. In the Assets panel, you can find a full list of available widgets in categories, and directly drag and drop one to a page to build your story. The widgets here are same as the ones from the Insert menu in the toolbar.
If the Assets panel is not open, from the toolbar, select
 View
View  Left Side Panel
 .
. -
From the Assets panel, expand Widgets, select a Chart or
Table widget, and then drag that widget to the body of the story page.
You are prompted to add data.
-
Save your story.
-
From the toolbar, select File Save.
-
From the toolbar, select
Results
The story is saved in the location you selected. If you saved the story to a public folder, it is visible to all users. If you saved the story to a private folder, only you can see and edit it until you share it with other users. For more information, see Share Files or Folders.
You can view your story by choosing View in the top-right corner. If your story doesn't contain scripting
elements, you can choose to view in the current browser tab or a new one via  (View Story In...). If it does, you can only view in a new tab.
To view the newly created story in a new tab, you need to save it first.
When you view in a new tab, only saved states are displayed.
By default the story is opened in view mode. In  Files you can also directly open it in edit mode by selecting Open in Story Edit Mode
from its
Files you can also directly open it in edit mode by selecting Open in Story Edit Mode
from its  (More Actions) menu.
Next Steps
As a story developer, you can add scripts to your widgets to implement custom-specific behavior in addition to basic user interaction in view time.
Learning Tutorial - Advanced Story
Click through the interactive tutorial illustrating how to create an advanced story with scripting in Optimized Story Experience (3:00 min); the tutorial is captioned exclusively in English:
-
In the Outline panel, hover over the widget you'd like to add scripts to.
-
Choose
 (Edit Scripts) to
its right.
(Edit Scripts) to
its right. -
Select one of the supported events, for example, onSelect.
The script editor opens in a new story tab, where you can write scripts for the widget.
You can also trigger scripting by selecting
Edit Scripts in the widget's (More Actions) menu. -
In the script editor, write scripts for the event of the widget, which are executed when viewers changes the selections on it, for example.