Import and Prepare Fact Data for a Classic Account Model
You are working with a classic account model and want to import fact data to your model.
Video: How to Import Data into Models
Open this video in a new window
In this video, you will import data into an existing model, map your data to the model dimensions and measures, review the available mapping options and import methods, and validate your data.
Creating an Import Job
Context
- SAP BPC
- SAP Concur
- SAP ERP
- SAP Fieldglass
- Workforce Analytics
- Dow Jones
Also, for the Salesforce data source, importing data into an existing model isn't supported.
Procedure
-
Select
 Import Data from
  File
File or Import Data from Data Source depending where your data is stored.
-
Select the data you want to import.
The import job is added to the Draft Sources or Import Jobs list, depending on whether you're working with a classic account model or a model with measures (i.e, the new model type). At this moment, you can save and exit the process and come back later by clicking
 . The uploaded draft data
expires 7 days after the upload.NoteThe draft source is visible to anyone with imports rights to the model.
. The uploaded draft data
expires 7 days after the upload.NoteThe draft source is visible to anyone with imports rights to the model.
Results
Preparing the Data
The data preparation step is where you can you can resolve data quality issues before the mapping step, but also wrangle data and make edits such as renaming columns, create transformations, etc…
First, make sure to resolve data quality issues if there are any. After the initial data import, the Details panel gives you a summary of the characteristics of the model with general information about the imported data, including any data quality issues.
For tenants based on an SAP Data Center, issues can be listed and described under the Model Requirements section if they are related to the model itself, or under the Data Quality section when you click a particular dimension.
For tenants based on a non-SAP Data Center, the Details panel list all the dimensions and measures of the model. You can click the icon to access more information. If ever the application has detected issues with a dimension, the exact number of issues with that particular dimension is indicated right next to its name, and clicking that number takes you straight to the Validation tab, where you can see a description of the issue.
Select a message to see the options available to resolve any identified quality issue. Use the context-sensitive editing features and the transform bar to edit data in a cell, column, or card. When selecting a column, a cell, or content in a cell, a menu will appear with options for performing transforms. This menu is two-fold:
- Choose the
Quick Actions option to perform actions
such as duplicate column, trim whitespace, hide columns, or
delete columns or rows. The table below lists all the available
actions.
- Select the
 (Smart Transformations) icon to list
suggested transformations to apply to the column, such as
replacing the value in a cell with a suggested value. You can
also select Create a Transform and choose
from the options listed under the transformation bar displayed
above the columns. The transformation bar is used to edit and
create transforms.
(Smart Transformations) icon to list
suggested transformations to apply to the column, such as
replacing the value in a cell with a suggested value. You can
also select Create a Transform and choose
from the options listed under the transformation bar displayed
above the columns. The transformation bar is used to edit and
create transforms.
As you hover over a suggested transformation, the anticipated results are previewed in the grid. To apply the transformation, simply select the transform. You can manually enter your own transformation in the transformation bar; as the transform is built, a preview is provided in the affected column, cell, or content within the cell. The table below summarizes the available transformations you can apply to selected columns, cells, or content within cells.
| Transformation | Description | Transform Bar Format |
|---|---|---|
| Delete Rows | Delete rows in the data, either by selecting individual members, or by specifying a range (not possible for text columns; only numerical and Date columns). | Provided only as a quick action |
| Trim Whitespace | Remove spaces, including non-printing characters, from the start and end of strings. | Provided only as a quick action |
| Duplicate Column | Create a copy of an existing column. | Provided only as a quick action |
| Delete Column | Delete a column. Use the Shift key to select and then delete multiple columns. | Provided only as a quick action |
| Remove duplicate rows | Remove duplicate rows when creating or adding data to a model. | Provided only as a task bar icon |
| Concatenate | Combine two or more columns into one. An optional value can be entered to separate the column values. | Concatenate [<Column1>], [<Column2>]… using "value" |
| Split | Split a text column on a chosen delimiter, starting from left to right. The number of splits can be chosen by the user. | Split [<Column>] on "delimiter" repeat "#" |
| Extract | Use this transform to extract a block of text specified as numbers, words, or targeted values within a column to a new column. | Extract [<what to extract]>]
[<where to extract>] [<which
occurrence>] [""] from [<column
name>] [<include value option>
]. Options for what to extract:
Options for where to extract relative to the target
value:
Options for specifying occurrence:
To extract the first number from all column cells, you would specify the following: Extract before first "" from [<column name>].To extract all text between parenthesis in column cells, you would specify: Extract everything between "(" and ")" from [<column name>]. |
| Change | Change a column to uppercase, lowercase, or title case. | Change [<Column>] to (<UPPERCASE>/<lowercase>/<TitleCase>) |
| Replace | Replaces either an entire cell or content that could be
found in multiple different cells. Note You can optionally
select  where to add a <where> clause
to the transform bar. You need to specify an associated
column and value when using a <where>
clause to limit the replace action in a given
column. where to add a <where> clause
to the transform bar. You need to specify an associated
column and value when using a <where>
clause to limit the replace action in a given
column. |
Replace (<cell/content>) in
[<Column>] matching
"value" with
"value" With a <where> clause: Replace (<cell/content>) in [<Column>] matching "value" with "value" where[<Column>]is "value" |
A history of all transforms you implement is displayed in Transform Log. There are two levels of transformation logs recorded: transforms on the entire dataset, and transformations on the currently selected column. Hover over a specific transform in the Transform Log to highlight the impacted column. You can roll back the change by either deleting the entries in the history or using the (Undo/Redo) buttons on the toolbar. You can remove transforms in the Transform Log panel out of sequential order provided that there are no dependencies.
- Numerical histograms are vertical, and represent the range of values along the x-axis. Hover over any bar to show the count, minimum, and maximum values for the data in the bar. The number of bars can also be adjusted by using the slider above the histogram. Checking the Show Outliers (SAP Data Center) or Include Outliers (Non-SAP Data Center) option includes or removes outliers from the histogram. Below the histogram, a box and whisker plot help you visualize the histogram's distribution of values.
- Text histograms are horizontal, and the values are clustered by count or
percent. The number of clusters can be adjusted by dragging the slider shown
above the histogram. When a cluster contains more than one value, the displayed
count is the average count for the cluster. The count is prefaced by a tilde
symbol (~) if there are multiple different occurrences. Expand the cluster for a
more detailed view of the values in the cluster along with individual counts.
Use the search tool to look up specific column values, and press Enter
to initiate the search. When you select a value in the histogram, the
corresponding column is sorted and the value is highlighted in the
grid.NoteThe displayed histogram is determined by the data type of the column. A column with numbers could still be considered as text if the data type is set to text.
Selecting Dimension Types
When you create an import job, the application automatically qualifies the data. Typically, columns containing text are identified as dimensions, and columns containing numeric data are identified as measures. You can still change the data qualification and change it to another type if needed. For example, you can change a Date dimension to an Organization dimension.
If you’re unsure about dimension types, make sure to check out Learn About Dimensions and Measures.
After you've selected your dimensions make sure to follow the best practices described in the sections below.
Maximum Number of Dimension Members
To maintain optimal performance, the application sets a limit to the number of unique members per dimension when importing data to a new model. For more information, check out System Requirements and Technical Prerequisites.
- In the data integration view, these dimensions cannot have any dimension attributes added to them, such as description or property.
- Once the dimensions are imported into the Modeler, they have only one ID column, and are read-only.
- The dimensions can't be used as exception aggregation dimensions or required dimensions.
- The dimensions can't be referenced in formulas.
Calculated Columns
While you're preparing data in the data integration view, you can create a calculated column based on input from another column and the application of a formula expression.
Click from the menu toolbar, and use the Create Calculated Column interactive dialog to build up your calculated column. Add a name, and build the formula for your column in the Edit Formula space. You can either select an entry from Formula Functions as a starting point or type “[" to view all the available columns. Press Ctrl + Space or Cmd + Space to view all the available functions and columns.
Click Preview to view a 10 line sample of the results of the formula. Click OK to add the calculated column to the model. If necessary, you can go back and edit the calculated column’s formula by clicking Edit Formula in the Designer panel.
For a listing of supported functions, see Supported Functions for Calculated Columns.
Dimension Attributes
Dimension attributes are information that is not suitable to be standalone dimensions. You can use them to create charts, filters, calculations, input controls, linked analyses, and tables (with “import data” models only). For example, if you have a Customers column, and a Phone Numbers column, you could set Phone Numbers to be an attribute of the Customers dimension.
- Description: The column can be used for
descriptive labels of the dimension members when the member IDs (the
unique identifiers for the dimension members) are technical and not
easily understandable.
For example, if your imported data contains a pair of related columns Product_Description and Product_ID with data descriptions and data identifiers, you can set Product_Description to be the Description attribute for the Product_ID dimension. Note that the Product_ID column would then need to contain unique identifiers for the dimension members.
- Property: The column represents information that is related to the dimension; for example, phone numbers.
- Parent-Child Hierarchy (Parent): The column is
the parent of the parent/child hierarchy pair.
For example, if your imported data contains the two columns Country and City, you can set the Country column to be the parent of the Country-City hierarchy.
The hierarchy column is a free-format text attribute where you can enter the ID value of the parent member. By maintaining parent-child relationships in this way, you can build up a data hierarchy that is used when viewing the data to accumulate high-level values that can be analyzed at lower levels of detail.
You can also create level-based hierarchies when your data is organized into levels, such as Product Category, Product Group, and Product. When the data is displayed in a story, hierarchies can be expanded or collapsed. In the toolbar, select
 (Level Based Hierarchy). For more
information about hierarchies, see Learn About Hierarchies.
(Level Based Hierarchy). For more
information about hierarchies, see Learn About Hierarchies. - Currency: If you set a column to be an Organization dimension, the Currency attribute is available. The Organization dimension offers an organizational analysis of the account data, based, for example, on geographic entities. You can add the Currency attribute to provide currency information for the geographic entities.
Data Quality Considerations
- In account dimensions, dimension member IDs cannot contain the following characters: , ; : ' [ ] =.
- Numeric data cells in measures cannot contain non-numeric characters, and scientific notation is not supported.
- When importing data to an existing model, cells in a column that is mapped to an existing dimension must match the existing dimension members. Unmatched values will result in those rows being omitted from the model.
- For stories, if any member IDs are empty, you can type values in those cells, or select Delete empty rows in the Details panel to remove those rows.
- When creating a new model, if member IDs are empty, they are automatically filled with the
“#” value if you select the Fill applicable empty ID cells with
the "#" value option. Otherwise, those rows are omitted from
the model.NoteThis option is only available on for tenants based on an SAP Data Center (Neo).
- In dimensions and properties, a single member ID cannot correspond to different
Descriptions in multiple rows (but a single Description can correspond to
multiple member IDs).
For example, if member IDs are employee numbers, and Descriptions are employee names, you can have more than one employee with the same name, but cannot have more than one employee with the same member ID.
- In a Date dimension column, cell values must match the format specified in the Details
panel.
The following date formats are supported: dd-mm-yy, dd.mm.yy, dd/mm/yy, dd-mm-yyyy, dd.mm.yyyy, dd/mm/yyyy, dd-mmm-yyyy, dd-mmmm-yyyy, mm-dd-yy, mm.dd.yy, mm/dd/yy, mm-dd-yyyy, mm.dd.yyyy, mm/dd/yyyy, mm.yyyy, mmm yyyy, yy-mm-dd, yy.mm.dd, yy/mm/dd, yyyq, yyyy, yyyymm, yyyy-mm, yyyy.mm, yyyy/mm, yyyymmdd, yyyy-mm-dd, yyyy-mm/dd, yyyy.mm.dd, yyyy/mm-dd, yyyy/mm/dd, yyyy.mmm, yyyyqq.
Examples:- mmm: JAN/Jan/jan
- mmmm: JANUARY/January/january
- q: 1/2/3/4
- qq: 01/02/03/04
- Latitude and longitude columns, from which location dimensions are created, must contain values within the valid latitude and longitude ranges.
- For planning-enabled models, in a hierarchy measure, non-leaf-node members are not
allowed.NoteFor analytic (non-planning-enabled) models only, non-leaf node members are allowed, but be aware of the effects of this behavior. For example: in an organizational chart that includes employee salaries, the manager has her individual salary, and her staff members have their own salaries as well. In a visualization, do you expect the manager’s data point to reflect her individual salary, or the sum of her staff members' salaries?
Combine Data with Your Acquired Data
After importing raw data into a new or existing model, or into a story, you may need to perform some data preparation.
You can combine data from another source with your acquired data by using up to three matching columns to join the two datasets.
- In Actions section of the toolbar, under
Actions, select the
(Combine Data) icon.
The Let's add some data! dialog is displayed.
- Select whether you want to add data using a file, or using a data source.
Once the new data is loaded, the Combine Data dialog is displayed. Under Combine Settings, a table representing all columns in the original data is displayed on the left, and a table listing columns from the new dataset is displayed on the right.
- Choose the most appropriate columns in each table to combine data. Click to select,
or drag columns to the field provided under Combine Column
for each table. NoteThe columns should be the best match and should not contain duplicates. You can use up to three columns to join the two datasets.
- Select how you want to combine the columns:
- All primary data: maintains the non-intersecting data from the original dataset.
- Intersecting data only: omits any data from the original dataset that does not match in the new data.
The results for the column combination in terms of Accepted, Duplicated, Nulls, and Omitted values are provided under Combine Preview. A sample of combined data rows is displayed under Data Sample.
- Select Combine when you are ready to combine the two tables.
NoteCurrently, when you combine data:
- The number of combined cells cannot exceed 30,000,000.
- The number of combined rows cannot exceed 1,000,000.
- The number of combined columns cannot exceed 100.
- You cannot run more than ten combine data processes on a given dataset.
- You cannot combine two datasets using a calculated column.
- You cannot combine two datasets in a story.
Import Cross Table Data
When you upload acquired data containing cross tables to the data integration view, the Transpose Columns into Rows action enables you to change selected columns into rows. The new table format can then be used to either import data or create a new model.
- Once the acquired data (or sample) is loaded in the data integration view, select the icon from the Actions menu.
The Transpose Columns into Rows panel appears in Details.
- Under Transpose Columns, select columns you want to include in the new table format. Choose Select All to include all the listed columns.
- Set Preview on grid on
 to preview the new format.
 - Select OK to implement the transform and to actualize
the new format.NoteTo undo the transformation, open the Transformation Log and delete the associated entry.
Mapping the Data (SAP Data Center Tenants)
Now that the data is prepared, you can start the mapping process. The application automatically pre-maps some parts of the data, and you can map the remaining data manually.
Context
- All dimensions are mapped.
- If the Version is mapped to a column, then the Category is also mapped to a column.
- There is only one Actuals version in the model.
- The Actuals category is mapped to public.Actuals for planning models.
- All measures are mapped.
- If there are multiple hierarchies in the dimension, and some dimension members don’t belong
to all the hierarchies, we recommend carrying out multiple data imports, one
for each hierarchy.
When the source column is mapped to a hierarchy of the target dimension, an empty cell in the source column means that after the import, the member will become the top node of the hierarchy, displayed as <root> in the dimension.
That empty cell during the data import does not mean that the member is excluded from the hierarchy. To make sure that this dimension member does not belong to a hierarchy after the import, you can either filter out the value using the delete row function during the data preparation step in the import mapping screen first, or do not map a column to the target hierarchy.
- We do not recommend adding the <root> or Not In Hierarchy members in the data source itself when importing data to a hierarchy, as these are interpreted as regular strings by the application and might cause unexpected issues in the dimension.
Procedure
-
Switch to the
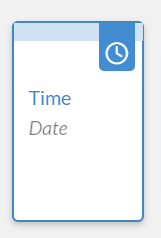
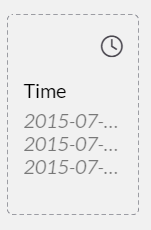
 Card View and determine what remains to be mapped. Cards
display as either mapped or unmapped entities. A card represents mapped data if
it is shaded solid and has defined borders. Cards that must be mapped appear
transparent and borderless.
Card View and determine what remains to be mapped. Cards
display as either mapped or unmapped entities. A card represents mapped data if
it is shaded solid and has defined borders. Cards that must be mapped appear
transparent and borderless.
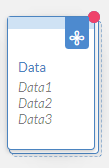
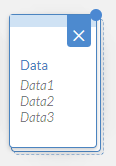
Dimensions with attributes appear stacked and can be expanded. Mapping attributes is optional.
-
Once you have mapped all cards, check for mapping issues. If there are any, fix
them before moving to the next step.
A red dot in the top right corner of the card indicates there are mapping errors that need to be addressed. A blue dot indicates that new values have been added from the import to the existing data.
Results
Reviewing and Running the Import
Once the mapping is complete, you're ready to review the import options and method before running the import job.
Context
Procedure
Scheduling an Import Job
Schedule a data import job if you want to refresh data against the original data source. You can import data from multiple queries and data sources into a model, and each of these imports can be separately scheduled.
Context
Procedure
-
Select one or multiple import jobs you want to schedule.
If you select multiple jobs, you can order them, set a group name for the job, and select one of the group processing option:
- Stop if any query fails: If any of the import jobs fails, the group processing stops. You can then cancel the remaining jobs, or try to fix the cause of the failure, and later resume execution of the grouping from the same point where execution stopped.
- Skip any failed query: If any of the import jobs fails, the remaining jobs are still processed.
NoteA grouping can include jobs from public dimensions as well as the model. Running the grouping refreshes the public dimensions and model together. You can ungroup your import at anytime clicking. -
Define the frequency for the scheduling:
- None: Select this option when you want to update the data manually.
- Once: The import is performed only once, at a preselected time.
- Recurring: The import is executed according to a recurrence pattern.
You can update the schedule at anytime clicking.