Creating Digital Boardroom Dashboards
Create a modern, exploratory, corporate steering dashboard.
Use Digital Boardroom dashboards to create freeform topics to match your business organization, then add and combine pages from any story.
Create a New Dashboard
- From the side navigation, select
 (Digital
Boardroom), then choose Dashboard (
 ) in
the Create New section.
 - In the Create New Presentation dialog, select a location (public, private, or workspace folder).
- Enter a unique name and an optional description and choose OK.
-
Enter a title for the root topic.
The root topic is the starting topic your presentation begins from. This topic can't be deleted. Populate this topic with a story page that works well as an introduction to the dashboard presentation, such as a business overview, or visuals showing the structure of the presentation.
-
Choose Design and open the
 Build panel. Enter a title and description
presentation properties.
Build panel. Enter a title and description
presentation properties.(Optional.) Set the Mobile enabled option if you want this presentation to be available on the mobile app.
- Choose
 to save your changes.
Import a Story
The content for your dashboard comes from story pages containing the visualizations and data you want to present. Let's import a story into this presentation.
- Choose Library to open the
 Stories panel.
 - Choose
 (Import) from the Stories
panel.
 - Select one or more stories from the Import Stories
dialog and choose Import.Note
Only responsive and canvas page types in a story are imported.
Imported stories are arranged as page bundles in the Stories panel and can be expanded to see the pages inside.
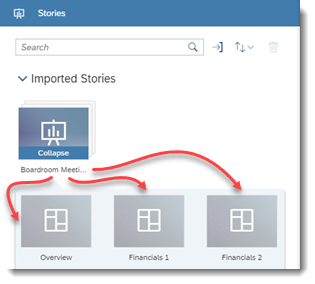
Once you have an imported story, it's time to build the structure.
Add Story Pages to Dashboard Topics
From the Stories panel, drag-and-drop a story page onto the root topic square.
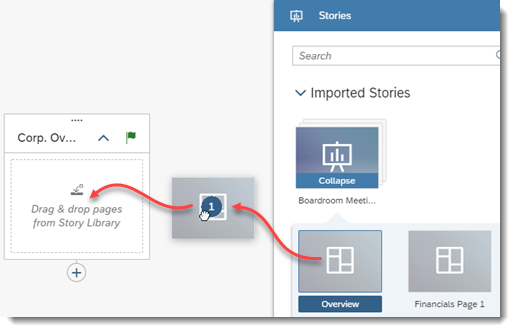
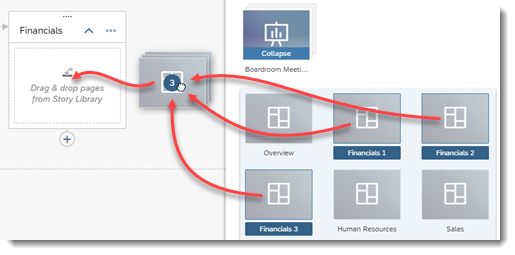
Topics are not limited to single story pages. You can drag an entire story or multi-select a subset of story pages and drag them all into a single topic to be displayed together. Limit the number of story pages to 20 or less to avoid overloading the topic.
After adding pages to a topic, you can change the order they are displayed
within the topic using a drag-and-drop approach, or even drag them to other existing
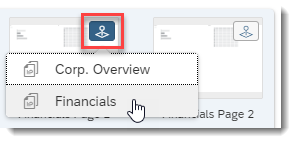
topics on the canvas. To help you keep track of everything, the
Stories panel indicates what story pages are already used
on the Digital Boardroom canvas with the  icon. Select
  to see a
list of topics the page is used in. Choosing a topic centers that topic on the
canvas:
At the top of the
Stories panel, select  and choose Used
stories or Unused stories to filter your view
of stories displayed in the panel.
Add More Topics with Navigation
With the root topic established, you can now start to build out your dashboard. By adding topics to the canvas, either connected in a parent-child relationship, or free-floating and accessible by navigation links, you create a navigation flow for possible exploration.
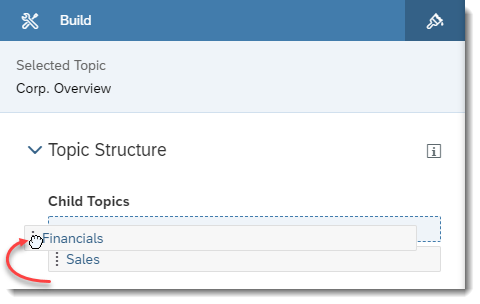
Wherever possible, create topics as connected children to other topics for
easier navigation. To view a list of all child topics, select a parent topic on
the canvas and then expand the Topic Structure section of
the  Build panel. You can change the order by clicking and
dragging a child to a new position.
Use free-floating topics and navigation links for content that you may cover optionally.
-
Click
 (Add
Topic) under your root topic to add a connected, empty
topic.
(Add
Topic) under your root topic to add a connected, empty
topic.When presenting, topics connected as children to parents will follow as the next topic using standard navigation options.
-
Choose from the Insert section of the toolbar.
Since this topic is not connected to a default navigation hierarchy, you can manually add a direct link (jump target) from story pages for navigation purposes.
-
Choose
 (Navigation) from the Tools section of the
toolbar.
(Navigation) from the Tools section of the
toolbar.The Navigation panel is displayed.
- Select a story page on the canvas.
-
Under the Page heading, choose + Add Jump Target. Use the canvas to select the story page to link to.
OR
Under the Tile heading, choose
 (New jump
point). In the dialog, select a tile, and choose
Add. Use the canvas to select the story page
to link to. If you selected a chart or table as the jump point and a
different topic as the target, you can also select Apply
selected dimension as a filter. With this setting, a
presenter can jump to the target and simultaneously apply the selected
value as a story filter. NoteJumping to a target from a value in a table or chart is not supported on mobile devices.
(New jump
point). In the dialog, select a tile, and choose
Add. Use the canvas to select the story page
to link to. If you selected a chart or table as the jump point and a
different topic as the target, you can also select Apply
selected dimension as a filter. With this setting, a
presenter can jump to the target and simultaneously apply the selected
value as a story filter. NoteJumping to a target from a value in a table or chart is not supported on mobile devices.You can change the labels for jump links afterward from the Navigation panel. These labels can help the presenter determine the target of the link.
When presenting that particular page, the link is available by right-clicking the page or individual tile with the link to open the context menu, and choosing Jump to.... For image, shape, text, and header tiles with jump links, you can also left click the tile to navigate directly to the target, or to pick the target if there are more than one.
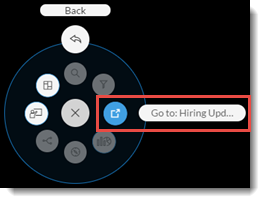 The label you used for the link is displayed. Select the link to jump to that new page.
For links with a filter, select the values you want to filter and choose
 from the menu that appears.
You can also mark a few important topics as featured to provide quick access to them during the presentation. Select to do so.
Simplify the Canvas View
-
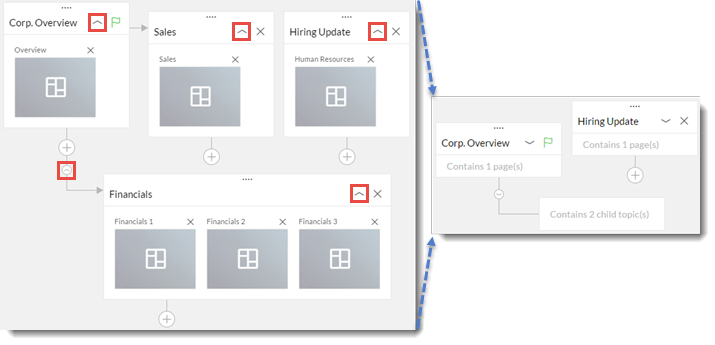
Condense individual topics by selecting
 (Expand/condense topic) on the topic.
 - Collapse entire topic trees under a parent topic by selecting
 (Expand/collapse topic tree) underneath the
parent topic.
 -
Use the zoom controls to zoom out (
 ),
zoom in (
 ), or
center the root topic (
 ) on
the canvas. You can also click and drag on the canvas to manually
reposition the entire dashboard. NoteSome dashboard interactions are limited when zoomed out. Zoom in to the maximum size to edit all aspects of the dashboard.
 (Delete).
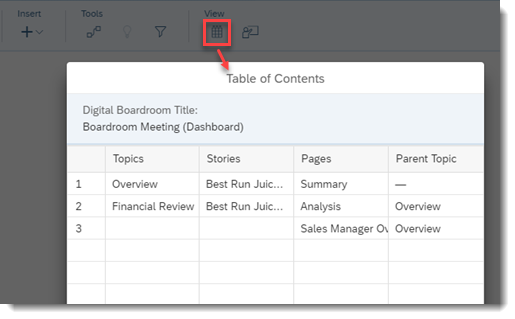
Open the Table of Contents ( ) from the View section
of the toolbar to see a list of all topics, stories, and story pages used in
the dashboard.
View Your Dashboard
At any time when building your dashboard, save and then choose  (Start
Presentation) from the View section of the toolbar to launch the
Digital Boardroom presentation.
For details on presenting your dashboard, see Running Your Digital Boardroom Presentation.
You can also customize the look of your Digital Boardroom presentation by setting display options and creating a custom theme. For details, see Presentation Settings and Theming.


