Optimize System Performance with the Analysis Tool
As an administrator of an SAP Analytics Cloud tenant, you can use the Performance Analysis Tool and the decision tree below to find resources that will help you resolve performance issues.
- Users with Read and Update permissions for System Information.
- Admin and BI Admin standard application roles.
The following instructions apply primarily to SAP Analytics Cloud (public and private). Some sections may also be applicable to SAP Analytics Cloud, Embedded edition depending on feature availability.
Use the Performance Decision Tree
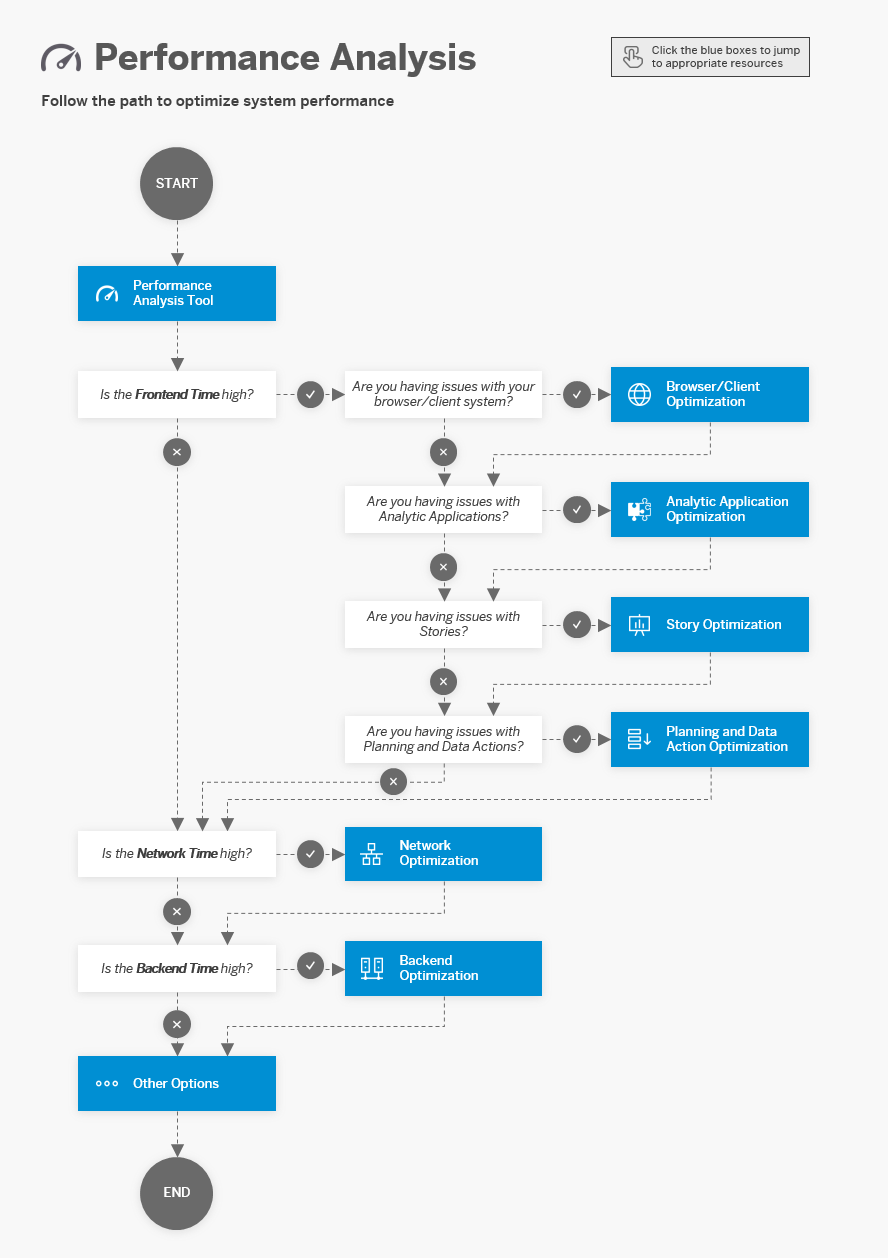
Follow the steps in the following decision tree to find resources that will help you to resolve performance issues.
This image is interactive. Hover over each area for a description. Click highlighted areas for more information.
Run the Performance Analysis Tool
Context
The Performance Analysis Tool identifies processing time by document for three major areas: Network, Frontend, and Backend. Based on the problem area, you can access the appropriate KBAs, Best Practice documents, and Help articles to support you in making performance improvements.
Procedure
-
To open the Performance Analysis Tool, choose

 System
  Performance Analysis Tool
 .
.
-
To set the date range:
- Click the Session Date token.
- Adjust the existing range or add a new range.
- Click OK.
-
To apply additional filters:
-
Click
 (Set
Filter) and select Resource
or User.
(Set
Filter) and select Resource
or User.
- Select the appropriate member(s).
- Click OK.
-
Click
- Click Search.
- In the list of results, click to select the document to analyze.
- Click the Runtime Distribution tab.
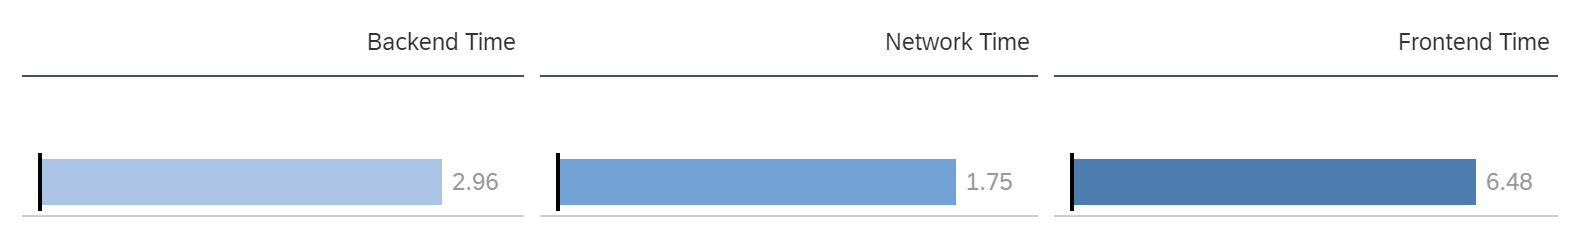
Results
You can now review the values for Backend Time, Network Time, and Frontend Time, and follow the decision tree below to determine where the performance issues are located and what resources will help you resolve them.
There are several strategies that can be employed when troubleshooting your system performance. Generally, it's advisable to reduce resource consumption before considering hardware upgrades or adjusting the design of stories and analytical applications.
Find Resources
Browser/Client Optimization
To optimize your browser/client:
-
Ensure your computer is plugged into a power outlet.
-
Check if the issue can be reproduced after closing all other browser windows, tabs, and applications.
-
Check if the issue can be reproduced when not teleconferencing, screensharing, screen recording, or playing video or audio.
-
Check if the issue can be reproduced when using a physical computer, rather than a virtual machine, if applicable.
-
Test your client’s score, as well as the latency and bandwidth to your SAP Analytics Cloud service: Analyze System Performance and SAP Analytics Cloud Performance Benchmark
 .
. -
Check if the third-party proxy is forcing the browser to use HTTP 1.1 instead of HTTP/2: 3056467 - Slow performance when accessing / consuming content in SAP Analytics Cloud (SAC)
. -
Verify that your system meets the appropriate system requirements: System Requirements and Technical Prerequisites.
-
Enable the “High Performance” power plan on the desktop that is accessing SAP Analytics Cloud: 2327454 - Low performance occurs in tables / grid and other areas of SAP Analytics Cloud
. -
Generate an HTTP archive (HAR) file to help troubleshoot system errors and performance issues in SAP Analytics Cloud: 2280022 - How to collect a HTTP archive (HAR) file (Chrome developer tools network trace) in SAP Analytics Cloud
. -
Analyze the performance of a Chrome page using Chrome DevTools: Performance features reference
 .
. -
Review and apply best practices from the SAP Community: https://community.sap.com/topics/cloud-analytics/best-practices-troubleshooting
.
Analytic Application Optimization
You can optimize application layouts to minimize resource consumption as much as possible. However, optimizing analytical application design to accommodate inadequate hardware is not a long-term solution.
To optimize analytic applications:
-
Reduce Application Loading Time
Long initial loading times may be caused by the initialization routine (onInitialization()). To reduce the loading time, avoid large tables by reducing and reusing with bookmarks. This allows you to provide an aggregated version of data and then guide the user to the necessary detailed level of data.
Avoid unnecessary backend calls. Remove redudant queries for unecessary data and repeatedly fetching values that seldom change.
Consider the sequence of scripted activities. Review the initialization routine and beginning with simple logic that does not require backend calls. If possible, move prefilling variables and filtering widgets to the end of the script, after hiding the busy indicator. This allows users to start working without having to wait. The remaining logic will then be applied in the background as long as background loading is activated in the Analytic Application settings.
Avoid backend roundtrips with setDimensionFilter() reuse filters. Remember to include the description of the desired member, not just the ID, when using setDimensionFilter() on tables. If left out, this method will trigger backend calls to fetch the description information, and cause unnecessary roundtrips.
-
Use Scripted Logic to Enable Selections
Use variables instead of constantly calling getMembers(). For each trigger of the selection dropdown, the method getMembers() is usually called and this triggers a backend query. Instead, save the results of retrieved cost centers into a variable of member array and pass this to the dropdowns instead of triggering a backend call each time.
Use variables for loop instructions and if-conditions. Avoid making repeated backend calls to validate the data lock states for a given selection, which happens when the validation logic is used within loop instructions. Pack the retrieved data-locking state, and user selection, into a variable, then reuse this in loop instructions and if-conditions.
Use local variables or function arguments over global variables.
Set up paused refresh for tables in the background as default. Pair this with the right refresh method to exercise precise control over the backend calls and delay result updates until the user interaction is completed.
Publish only when done. Publishing immediately often leads to adding logic to the onResultChanged() event, which increases the burden for refresh. This is used to prevent users from forgetting to publish, but by removing this script and motivating users to only publish once when done is more efficient. The risk of users forgetting to publish can be minimized by designing the interface carefully to include an eye-catching “publish” button or utilizing the calendar to send the application out to corresponding assignees.
-
Data Action Execution
Performance impacts may lie either with the data action itself, the manner and frequency with which it is being executed within the application, or both. It is critical to understand the technical design and logic of the underlying data action to effectively manage its triggering, execution scope, effective runtime, and frequency, as perceived by the end-user, who often does not have the visibility nor interest in the nuance associated with script overhead and actual data action execution times.
Manage scope and reduce execution frequency. When using multiple data actions for a single planning activity, consider merging those with the same scope, or even just the steps within. Since the execution of these data actions are often paired with setParameter(), refresh(), and other API calls within the Analytic Application, the designer needs to incorporate them into the application’s workflows so they are triggered appropriately to meet business objectives. For example, it makes no sense to trigger a data action every minute that is expected to take 2 minutes to execute based on its scope. In this case, it makes sense to take data action scoping into consideration for scripted data action execution and consider manual triggers such as buttons if more transparency is required for their execution.
-
Review and apply the best practices in Chapter 14 of the Developer Handbook to improve application performance of your apps: SAP Analytics Cloud, Analytic Designer – Developer Handbook
-
Review and apply additional best practices: Performance Best Practices for SAP Analytics Cloud, Analytic Designer
and Best Practices for Performance -
Review and apply best practices from the SAP Community: https://community.sap.com/topics/cloud-analytics/best-practices-troubleshooting
.
Story Optimization
Stories contain multiple widgets that can be optimized individually. You can consider simplifying the story to minimize resource consumption as much as possible. Adjusting story design to accommodate inadequate hardware is not a long-term solution. However, you may want to improve the performance of tables and visualizations, in addition to providing enhanced usability improvements and capabilities.
Stories
To optimize stories:
-
Use Responsive Pages
Responsive pages allow story content to re-flow depending on the size of the screen it is being viewed on. Responsive pages are also the only page-type that can be viewed with the SAP Analytics Cloud Mobile App for iOS.
-
Use Fewer Pages
When a story has a lot of pages, adding more pages can decrease the story’s performance. When possible, create a new story for each use-case or rearrange the story’s content to use fewer pages. In contrast when rearranging the content, try to limit the number of data-related widgets on a page.
-
Manage Process-Heavy Widgets on a Page
Story performance can be slowed when there are a lot of widgets on a page, particularly data-related (process-heavy) widgets. For example, multiple charts, tables, or filters on a page. For faster performance, consider changing the types of widgets that are being used or reducing the number of heavy widgets per page.
To determine the best performance for a story, the widgets are assigned a unit weight, with the maximum ideal weight per page set to 5 units. The following table shows the unit weight per widget:Widget Unit Weight Table 0.6 Chart 0.3 Geo Map 1 Filters, exapnded 0.4 Filters, not expanded 0.2 Section on page 0.5 Value Driver Tree 1 R Widget with at least 1 data frame 1.2 Text Box With Dynamic Text 0.2 Dynamic Image 0.3 Commenting Widget 0.1 Text Box 0.1 iFrame or Web Page 0.1 RSS Feed 0.1 Image, Shape, or Clock 0.1 -
Collapse Page Filters and Input Controls
Expanded page filters or input controls are convenient because you can quickly select members or search for members in the control. However, an expanded input control refreshes often and that can affect the story's performance. When the input control is collapsed, you must select the control to display the member list before you can search or make selections. When a high cardinality dimension exists, leaving that dimension expanded can affect a story's performance.
When you have filters for dimensions with large hierarchies, limit the levels available in the filter for easier navigation.
-
Review and apply best practices from the SAP Community: https://community.sap.com/topics/cloud-analytics/best-practices-troubleshooting
.
Tables
The larger the result set rendered into the table, more of your user's client resources are consumed in the browser session. The performance impact will thus very much depend on one’s client specifications.
To optimize tables:
-
Limit the number of tables on the page to enhance readability, decrease the number of backend requests, and improve performance.
- Result sets are limited to 30,000 cells (i.e. 500 rows and 60 columns) by default. It is generally more beneficial to limit the number of columns than rows.
-
If you are working with high cardinality dimensions, consider manually setting the Top N values rather than using Auto Top N. When Auto Top N is used, all the data is transferred from the system before the Top N data is rendered. When a Top N is used, the data is sorted, and the Top N values are selected in the system. Only the Top N data is sent.
-
Keep dimension hierarchies in a collapsed state rather than a list of all combinations. The user can then quickly navigate through the hierarchy nodes to find the right set of data. The data the user is not interested in will remain hidden below the collapsed hierarchy nodes. If a certain navigation state is desired at start-up, it can be saved with the story.
-
Input controls and story filters allow users to filter the result set for relevant combinations, so that the result set only contains relevant data. Story filters can also be filled via URL API usage.
-
The linked analysis feature offers ways to select data in one widget and automatically filter data in a second widget. This way one could select data in a widget on an aggregated level and offer a drill down on further dimensions for more details in a second table. This is preferable to generating a large result with many dimensions.
-
Dimension settings for booked data as well as zero/null suppression, allow you to further reduce the number of cells to be rendered in the table. The Add Member feature allows to create new data while hiding the other unbooked combinations.
- Applying individual formatting to a table can be very expensive from a performance standpoint. Where rich styling is required, try creating and applying styling rules instead of formatting each table.
-
Enable the “High Performance” power plan if scrolling in tables is slow: 2327454 - Low performance occurs in tables / grid and other areas of SAP Analytics Cloud
-
Review and apply best practices from the SAP Community: https://community.sap.com/topics/cloud-analytics/best-practices-troubleshooting
Charts
To optimize charts:
-
Limit the number of charts on the page to enhance readability, decrease the number of backend requests, and improve performance.
-
Avoid charts with more than 500 data points.
-
Be aware of progressive chart rendering, which enables chart widgets to display more quickly when a story is opened a subsequent time: 2604574 - Charts in stories open significantly faster the second time in SAP Analytics Cloud
. -
If you are working with high cardinality dimensions, consider manually setting the Top N values rather than using Auto Top N. When Auto Top N is used, all the data is transferred from the system before the Top N data is rendered. When a Top N is used, the data is sorted, and the Top N values are selected in the system. Only the Top N data is sent.
-
Review and apply best practices from the SAP Community: https://community.sap.com/topics/cloud-analytics/best-practices-troubleshooting
.
Geo Maps
To optimize geo maps:
-
Reduce the number of data points displayed on maps.
-
Enable location clustering for 1,000+ points, instead of the default of 5,000+ points.
-
Construct the layout of maps to limit zooming and panning if location clustering is enabled, as each movement submits a backend query.
-
Apply best practices to geo maps that take longer than a minute to load: 2676310 - Story with geo-map loading slowly in SAP Analytics Cloud (SAC)
. -
Review and apply best practices from the SAP Community: https://community.sap.com/topics/cloud-analytics/best-practices-troubleshooting
.
Images
To optimize images:
-
Use the SVG format instead of PNG, JPG, or BMP.
-
Leverage header images, whenever possible.
-
Use Fiori Styles/Fonts instead of images.
Planning Specific Story Optimization
Performance issues can be identified in much the same method used for stories or analytical applications. However, you also have to consider the data entry mode assigned, and unbooked member settings, as part of the table layout design.
-
Data Entry Mode
Configure any table being used for data entry to use either Fluid Data Entry or Mass Data Entry as the default data entry mode. Avoid using Single Data Entry if possible. For most scenarios, Fluid Data Entry is preferred because it provides most of the performance advantages of Mass Data Entry, while still allowing interactivity within the table and other story widgets.
Fluid Data Entry allows the user to quickly enter multiple cells without sending any information to the server or repetitively resulting in a recalculation or rendering of other objects in the story or analytical application. The server processing and recalculation of any updates will be deferred until the user pauses their current data entry update. By default, this pause is for 1 second, but this can be configured within the system administration console. After the pause, updates will be sent to the server, any impacted model formulas will be evaluated, and the results and rendering of the story with data updates will occur. In some rare cases, large data updates may still benefit from use of Mass Data Entry, however this mode requires the user to take the specific action to processes changes on the server side.
-
Display of Unbooked Cells
Minimize the display of unbooked cells. Unbooked cells are very expensive to render and can easily multiply when multiple dimensions are nested in the rows or column.
Only show unbooked cells on the inner dimensions, where possible. This is because enabling display on outer dimensions first (left or top dimensions) automatically enables it on all inner dimensions (right or bottom).
For all nest dimensions, it is critical to selectively filter only the required display members
Consider selective seedingof relevant combinations. Specifically, this would involve using a Data Action to pre-populate dimensional combinations for display
Mobile App
To optimize stories for the Mobile app:
-
Check that you have the appropriate network speed and meet the specific device requirements for the SAP Analytics Cloud Mobile app: 2699872 - How to improve performance in the SAP Analytics Cloud (SAC) mobile app for iOS
Other
To optimize other elements:
-
Reduce the number of queries and enable optimized viewing: Optimized Story Experience
-
Consider tips in the Performance Improvement section related to Active Viewport Rendering and Optimized View Mode: Experience Performance and Usability Improvements with SAP Analytics Cloud Stories
-
Apply additional best practices: Best Practices for Performance
-
Do some more investigation into the cause of the issue: How to Isolate a Performance Issue in SAC Stories?
-
Activate the HTTP/2 protocol. Note that this can lead to issues if the backend is unable to handle the increased load, so consider the trade off of using this option: HTTP/2 Support
Planning and Data Action Optimization
While the Performance Analysis tool provides a dedicated section for Data Action performance, the Data Action Monitor is the preferred tool for understanding runtime information about any specific action. Within the monitor you can see the run history for all jobs you have executed or, if you are an administrator, for all jobs executed across the tenant. For any individual job, you also can view detailed step information including number of records affected per step. For more information, see Monitor Data Actions.
For almost any degradation of performance not directly related to either a consistent queuing of action, or other external factors, it is worth revisiting specific optimization steps available to streamline execution times for data actions and multi actions.
-
Filtered Execution
Minimize the scope of execution by strictly controlling the filters passed at runtime. Remove user involvement in the filtering process. For example, you can hardcode as many single filter members as possible in the component steps of the data action, and filter as much as possible using input controls and story filters.
-
Focused Execution
Reduce the number of operations being performed within a given data action or multi action execution whenever possible. Not all steps within a given data action or multi action maybe required with each execution. For example, a data action may perform some driver-based calculations within a given model, while also synchronizing data to and from another model. In this case, refinement of the data within the working model may take some time, and consistently synchronizing data to and from another model maybe wasteful if it is not a direct dependency for the data being calculated. You can try to create more than a single data action or to modularize the data actions and run them in a nested fashion with multiple discrete or modularized actions.
-
Modularization
When given the choice between modularizing a data action via a nested data action, or including of steps within a multi action, choose nested data actions. Each data action step within the multi action is treated as a discrete activity and this results in additional overhead in the form of instantiation and clean-up costs for each step. This is likely more noticeable for shorter duration executions where the percentage of time consumed by the non-value add activities is a greater proportion of the overall execution time. However, modularization is not always ideal, particularly with steps involving advanced formulas.
-
Member Sourcing
If referencing members is required, use data action copy steps to allow sourcing data from calculated members or parent members. For example, in scenarios where you may need to persist or read the same calculated value twice in different steps, you may choose to have the first step persist the result, and then the second or third step read from this persisted result.
Allocations can leverage calculated members as the allocation key or driver on which to spread target values. Preference should be given to reducing the reliance on this type of allocation key. For example, if the desired allocation is based on a previous year value, you may want to persist the key in the current year rather than always referencing that value in a lookup calculation in an account/measure. In such a case, the historical value is unlikely to change, so consistently referencing a static value via a calculated account/measure creates unnecessary expense with each allocation execution.
-
Reference Members (Allocations)
Limit the number of defined reference dimensions, and in particular use run-time filtering, if possible, to limit the scope of reference member dimensions that need to be processed.
-
Apply best practices for designing planning models: SAP Analytics Cloud for Planning: Modeling checklist
-
Apply best practices for using calculations: SAP Analytics Cloud for Planning: Optimizing Calculations
-
Adjust calculations to incorporate calculation scope and optimum use of FOREACH, IF, and RESULTLOOKUP functions: Optimize Advanced Formulas for Better Performance
-
Apply best practices for the planning area:
-
Review and apply best practices from the SAP Community: https://community.sap.com/topics/cloud-analytics/best-practices-troubleshooting
Any discussion of calculation scope for advanced formulas is related to the discussion of filtered execution with data actions. Any runtime variables defined for the data action are available, and often used in the advanced formula steps as well. However, with advanced formulas filters, definition and execution scope are handled differently.
-
Calculation Scope
Minimize the individual scope in any given run to only iterate over the data regions required for the calculation, and minimize specific overrides within the read or write statements. The advanced formula editor provides a built-in scope indicator anytime you hover over a Data() statement or ResultLookup() to indicator the number of members for each dimension which are included in the scope.
-
Number of Data() and ResultLookup() functions
Arrange calculations such that the script is not forced to execute the same ResultLookup() more than once if possible. Each instance of Data() and ResultLookup() results in a query. The more of these statements which exist within the body of the advanced formula, the more the processing time will be required to execute the script. Order syntax to streamline the number of these query statements.
-
Conditional statements
While not all IF statements are equal in terms of their performance impact, each statement will generate a subquery to evaluate its result. Thus, it is advisable to try and limit or avoid unnecessary conditional statements.
-
Loops
Remove unnecessary Foreach loops. The advanced formula editor will warn you when a Foreach loop has been unnecessarily included, and in such cases, you should remove the loop reference as it will increase runtimes and system resource usage with no additional benefit. Where Foreach is used, you may be able to improve the overall script performance by looping over attributes rather than over individual members.
-
Rationalization of Steps
Advanced formulas scripts are not meant to be written in a manner consistent with formal programming concepts. Even in scenarios where conceptually splitting up logic into sub-steps may imply a more readable/logical flow, this is not always suggested, particularly if taken to an extreme, as this will result in additional processing overhead.
-
Dimension Aggregate Function
Where referencing specific members within a given dimension is unnecessary, and the total values of all members within the dimension is desired, the Aggregate_Dimensions and Aggregate_WriteTo formulas should be used. This allows you to read and write the target value in a single execution rather than unnecessarily iterating over members of that dimension.
-
Other unexplained variations in processing time
If a given advanced formula step/process becomes significantly more time consuming seemingly for a non-apparent or non-obvious reason, open the corresponding Data Action/advanced formula, make a small change to each step and resave the process. This will recompile the script and may result in improved execution times, particularly if significant model changes have occurred.
Network Optimization
To optimize the network:
-
Check the reverse proxy, VPN, and wireless network
-
Check if the issue can be reproduced without VPN, if permitted by company policy
-
Check the network conditions on SAP Data Centers to determine if there are critical outages:
-
Check if the third-party proxy is forcing the browser to use HTTP 1.1 instead of HTTP/2: 3056467 - Slow performance when accessing / consuming content in SAP Analytics Cloud (SAC)
-
Generate an HTTP archive (HAR) file to help troubleshoot system errors and performance issues: 2280022 - How to collect a HTTP archive (HAR) file (Chrome developer tools network trace) in SAP Analytics Cloud
Backend Optimization
The connection type impacts the resources available to assist with addressing performance issues.
SAP HANA Live
To optimize SAP HANA live connections:
-
Apply best practices for SAP HANA Live connections: SAP Analytics Cloud – HANA Live Connection Best Practices
-
Use information views in performance analysis mode to check the performance impact at runtime of calculation views: Open Information Views in Performance Analysis Mode
-
Consider tips and tricks to improve performance of SAP Analytics Cloud with live SAP HANA connections: HANA live performance
-
Use Implicit SQL optimization of SAP HANA Calculation Views: 2223597 - Implicit SQL optimization of SAP HANA Calculation Views
-
Take advantage of enhancements to the query analytic processing engine inside HANA, which is enabled in SAP HANA Cloud but disabled in SAP HANA 2.0: 3139162 - EPMMDS: New processing Engine (CPC)
-
Avoid joins on calculated objects when SAP HANA live connections are used
-
Review and apply best practices from the SAP Community: https://community.sap.com/topics/cloud-analytics/best-practices-troubleshooting
SAP Universe Live
To optimize SAP universe live connections:
-
Apply best practices for live universe connections:SAP Analytics Cloud – Live Universe Consumption (LUC) Best Practices
SAP BW Live
To optimize SAP BW live connections:
-
Apply best practices for SAP BW live connections: SAP Analytics Cloud – BW Live Connection Best Practices
-
Review how to measure performance with live BW scenario: BW Live Connectivity Performance
-
Optimize SAP BW queries:
-
Achieve a significant runtime gain by using "Values in Master Data Table": 2245483 - Long runtimes for input help - read mode "Only Values in InfoProvider"
-
Evaluate M-Mode, D-Mode and Q-Mode for trade-off of convenience versus performance: 1565809 - BW Query Input(F4) Help: Settings and Properties
-
Enable traces to evaluate performance impact:
-
Review and apply best practices from the SAP Community: https://community.sap.com/topics/cloud-analytics/best-practices-troubleshooting
SAP BW/4HANA
To optimize SAP BW/4HANA connections:
-
Choose the right mode to ensure optimized operations can be performed: Optimizer for Operations in SAP HANA
SAP S/4HANA
To optimize SAP S/4HANA connections:
-
Find best practice documentation for SAP S/4HANA: 2748973 - Where can I find more information on SAP S/4HANA Cloud / SAP S/4HANA On-Premise and SAP Analytics Cloud integration best practices?
SAP Datasphere
To optimize SAP Datasphere connections:
-
Use the HANA Plan Visualizer: Troubleshooting SAP Datasphere Performance Issues with the HANA Plan Visualizer
-
Apply best practices for SAP Datasphere connections: Best Practices and Troubleshooting
-
Run in Analytics Mode to optimize performance: Perspective in Analytics Mode
-
Create statistics for your remote tables to provide efficient query execution plans: Creating Statistics for Your Remote Tables
Data Acquisition
To optimize data acquisition:
-
Increase the maximum memory allocation for Apache Tomcat: 2732879 - Modify SAP Analytics Cloud agent Apache Tomcat memory allocation for Tomcat7_SACAgent
-
Apply best practices to troubleshoot data acquisition issues: 3158133 - SAP Analytics Cloud Best Practice - How to analyze relavant traces to help troubleshooting issue - Set up data acquisition
-
Review data integration limits for models, datasets, and stories: System Sizing, Tuning, and Limits
Other
To optimize other connections:
-
Review security recommendations for live connections: SAP Analytics Cloud – Live Connection and Security – Best Practices
-
Apply best practices for exporting to CSV and Microsoft Excel: Best Practices for SAP Analytics Cloud CSV and Excel export performance
Other
While minimizing CPU intensive applications and processes may optimize performance for the end-user hardware, the problem may be that the client hardware is simply underpowered and upgrading your client hardware may fix performance issues. For more information on system requirements, see System Requirements and Technical Prerequisites.
Here are some additional resources that may be helpful: